
 Gallery
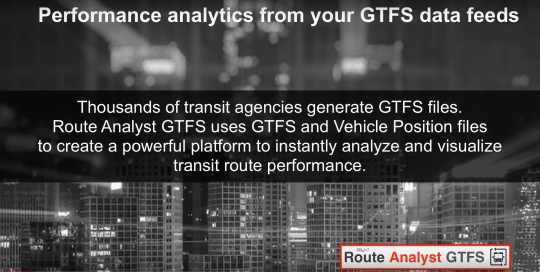
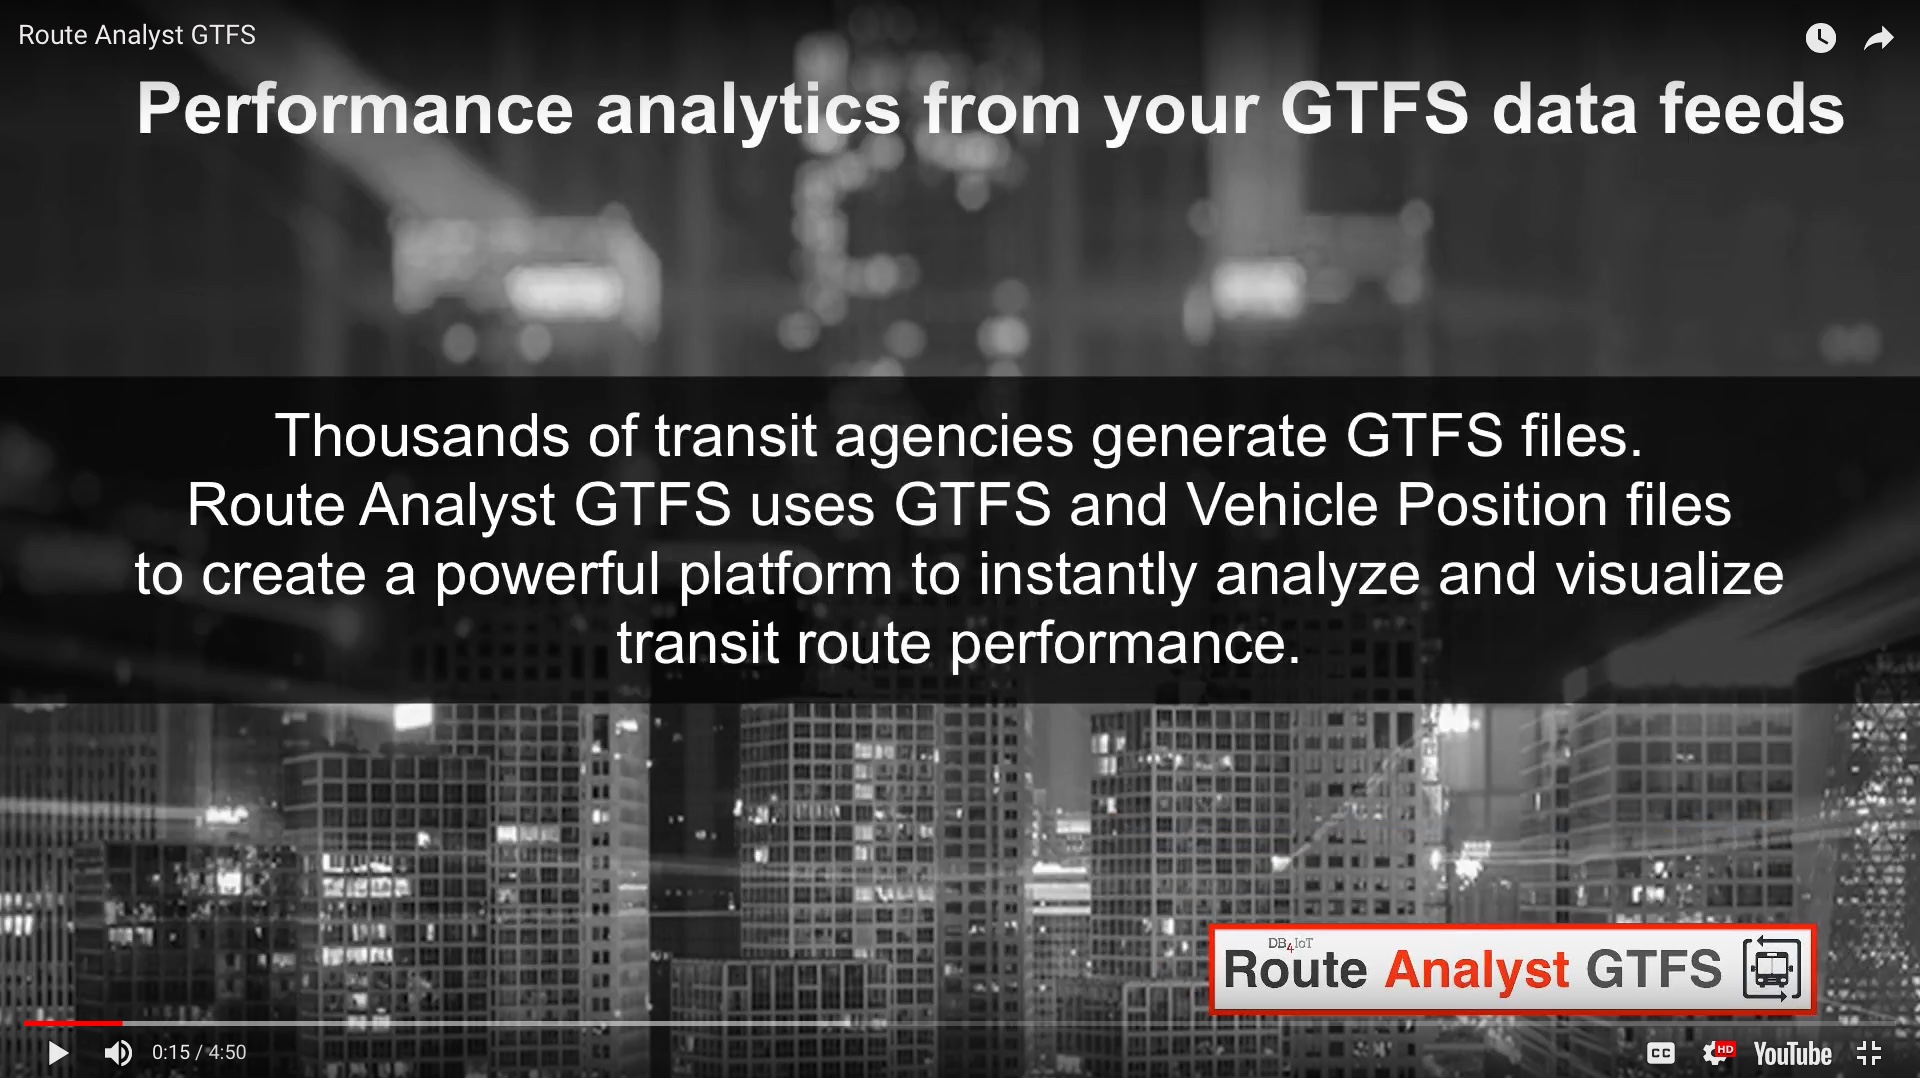
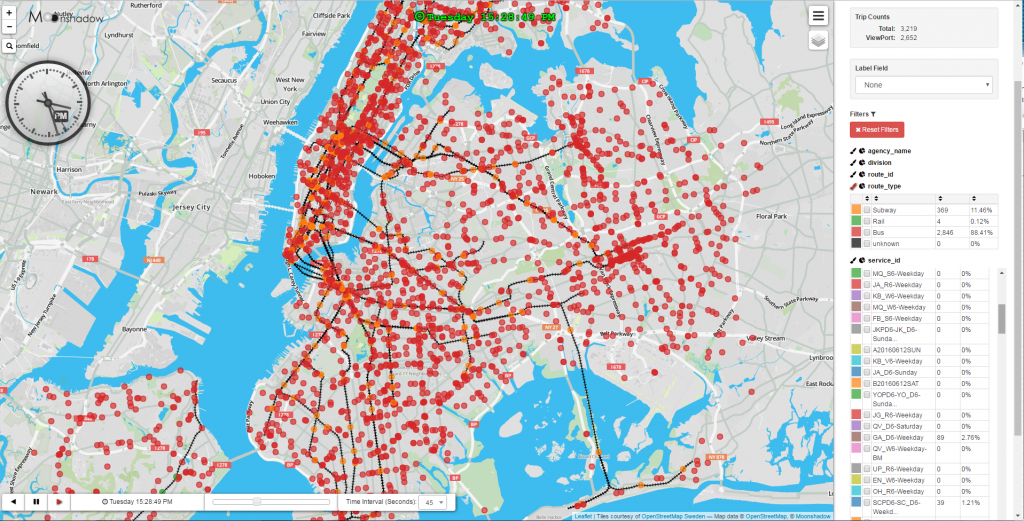
DB4IoT Route Analyst GTFS delivers performance analytics from your GTFS data feeds. DB4IoT Route Analyst GTFS is powered by DB4IoT – the database engine for the Internet of Moving Things.
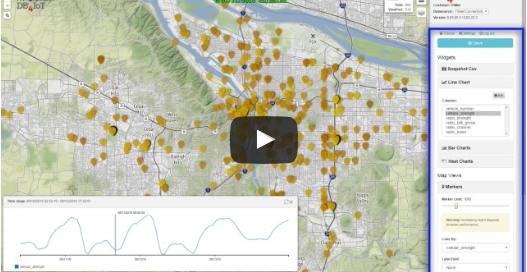
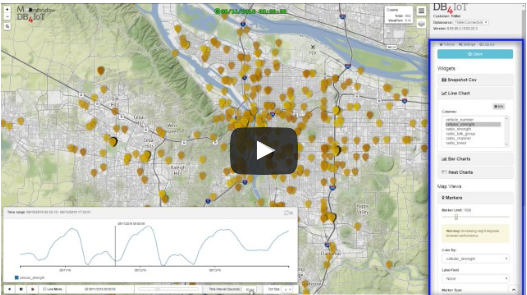
DB4IoT Route Analyst GTFS creates speed, delay and headway maps, charts and graphs instantly from your GTFS and GTFS-RealTime feeds. Learn more db4iot.com/route-analyst-gtfs/
 Gallery
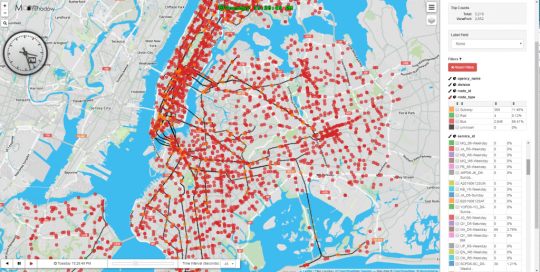
 Gallery
 Gallery
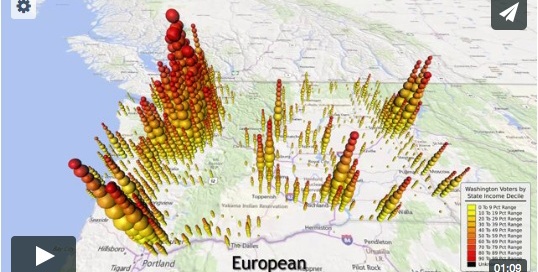
 Gallery
 Gallery
 Gallery
 Gallery