
 Gallery
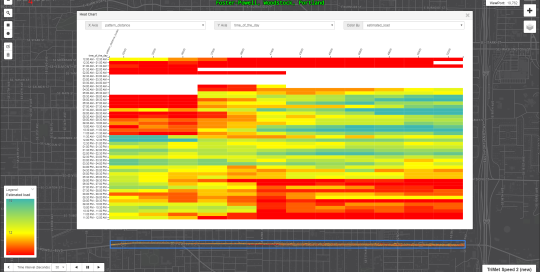
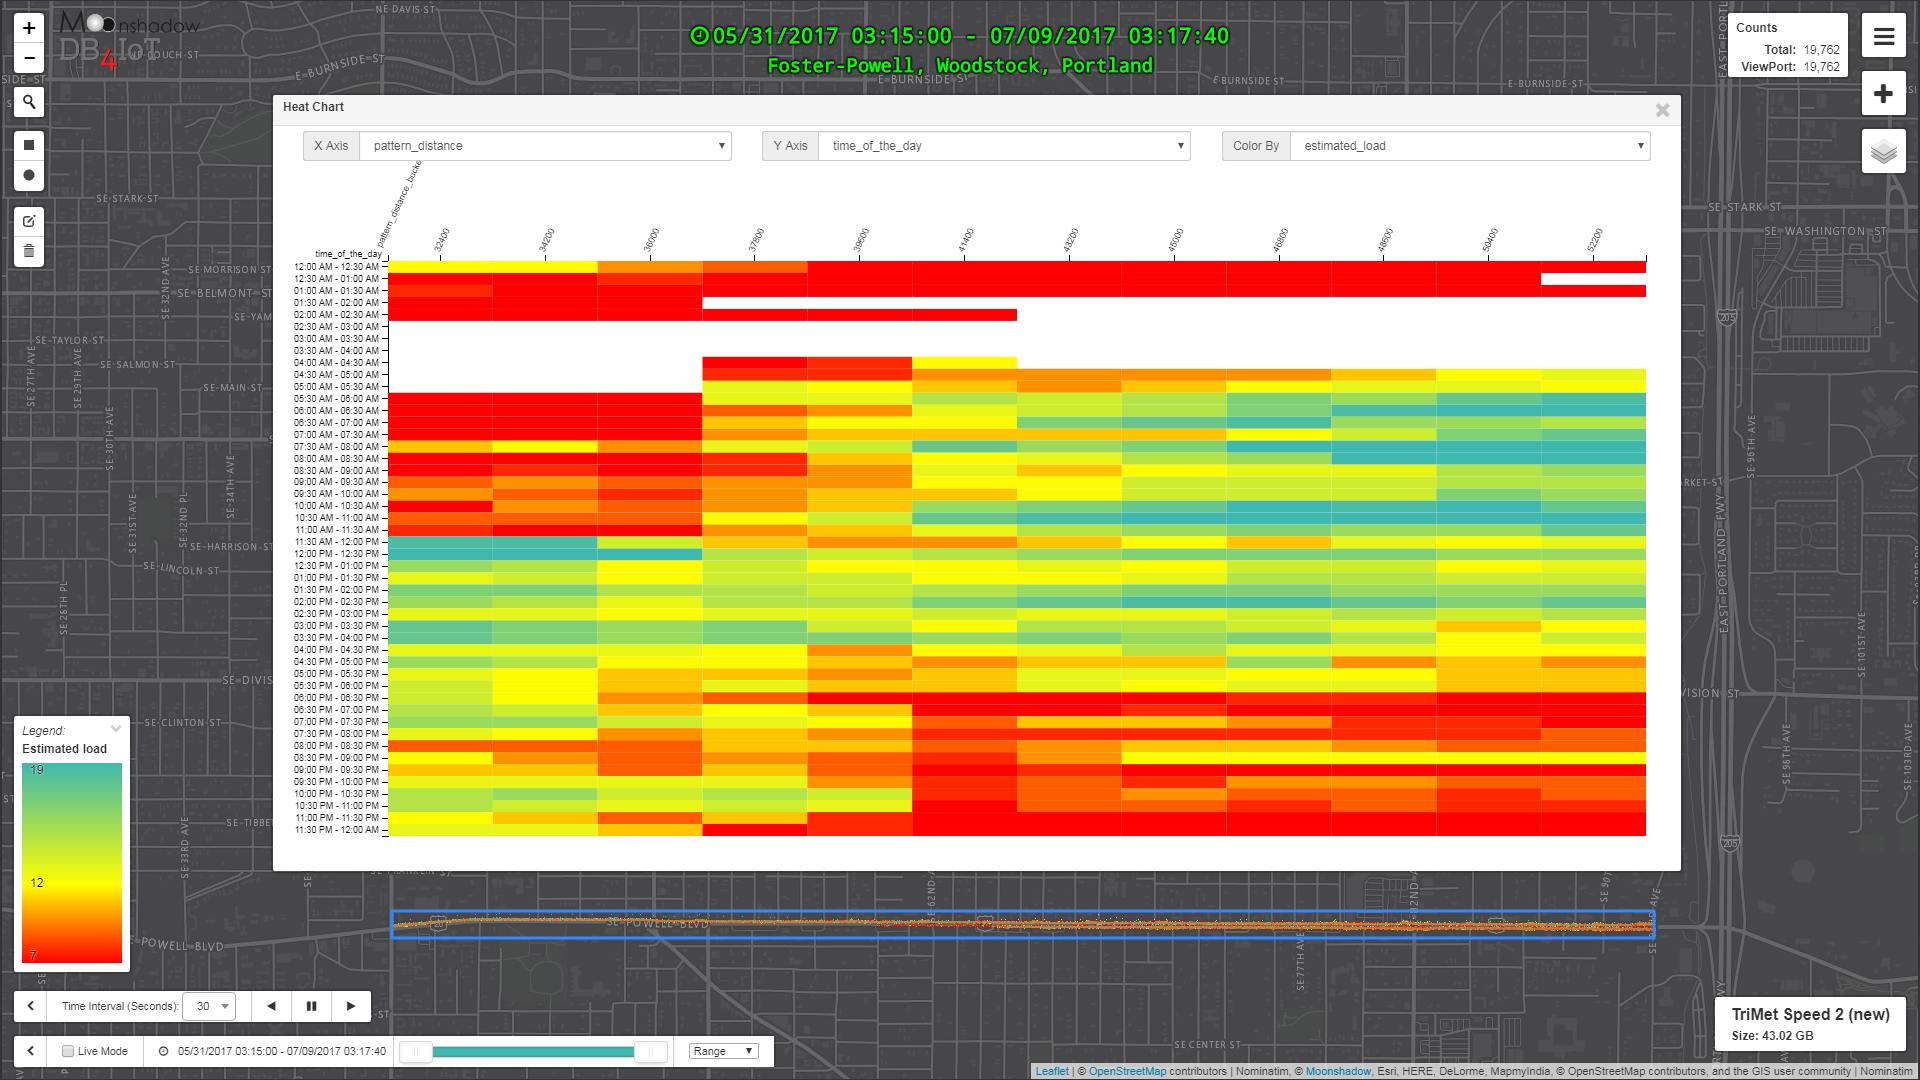
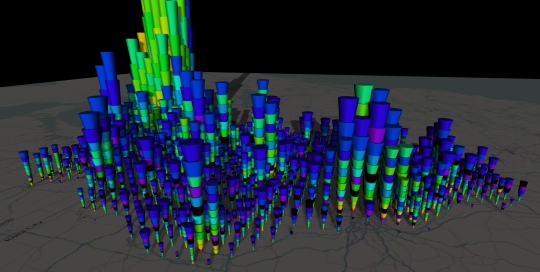
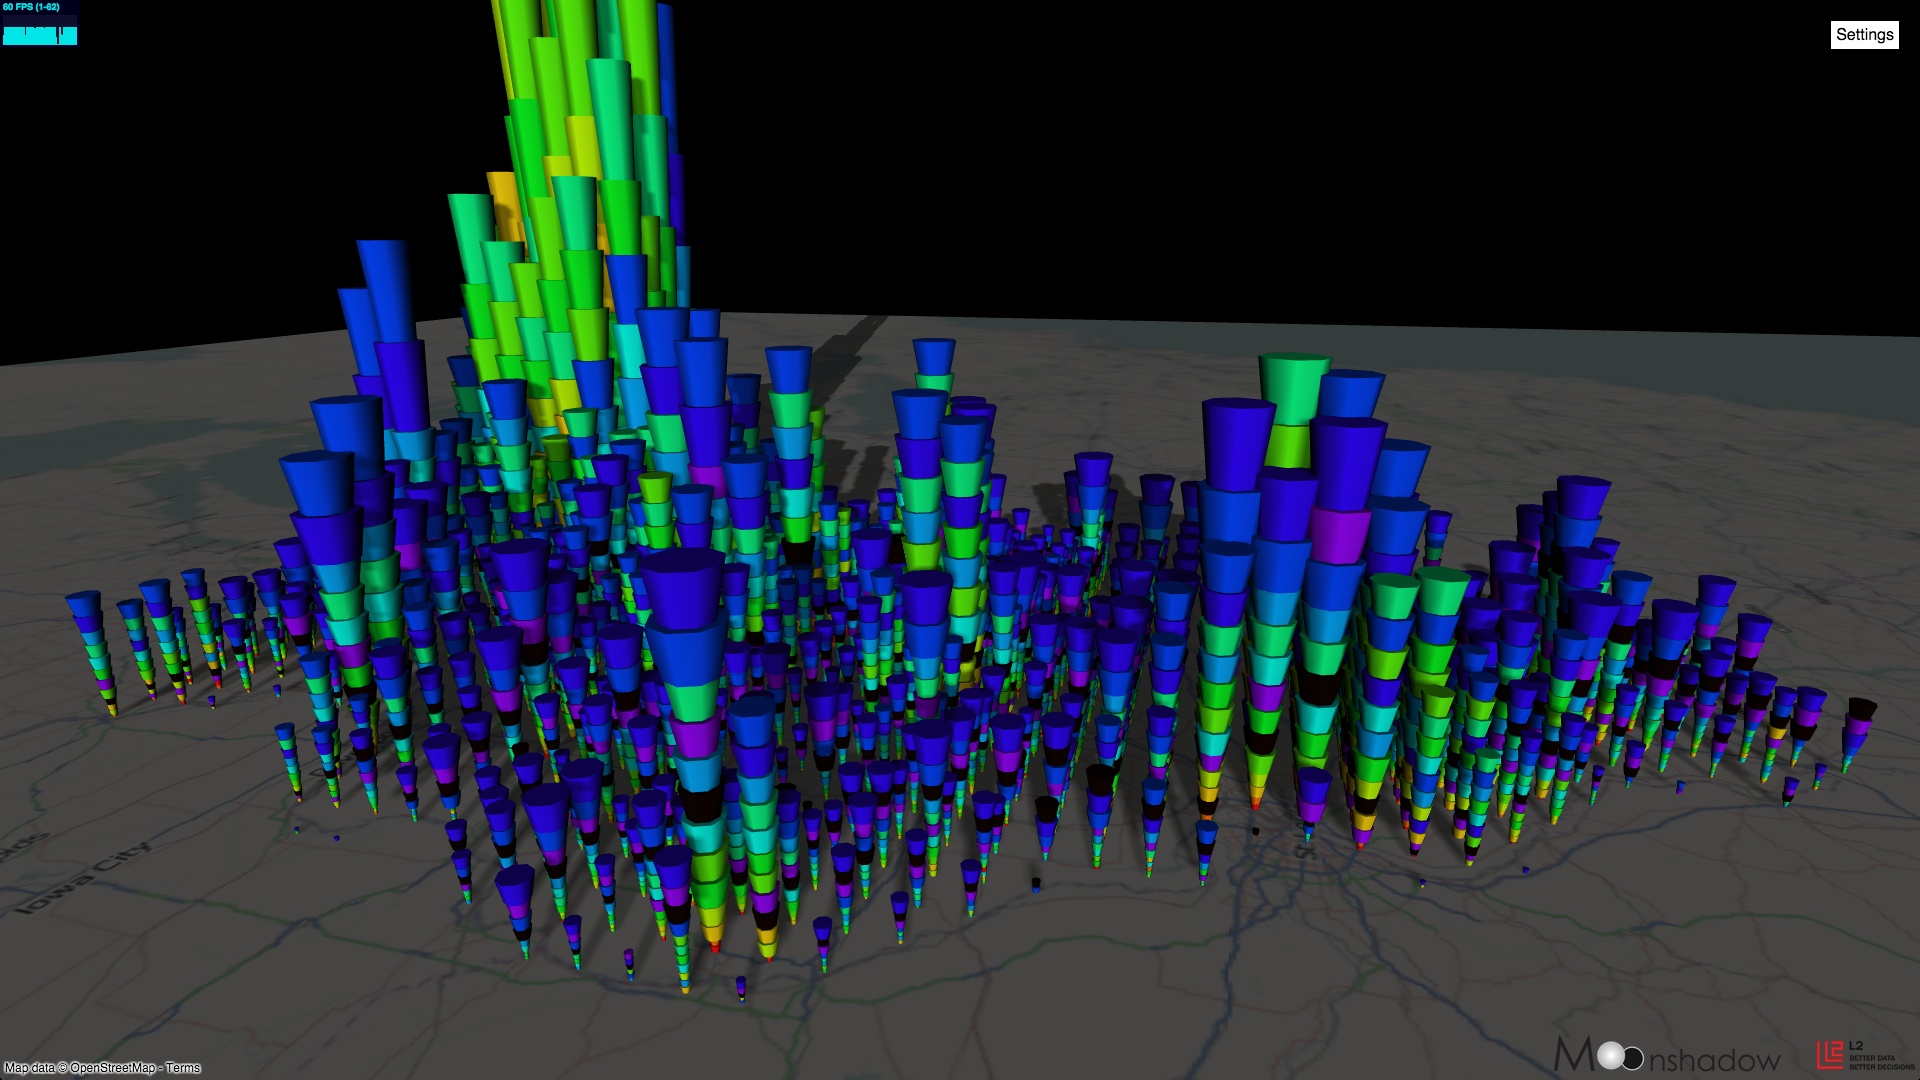
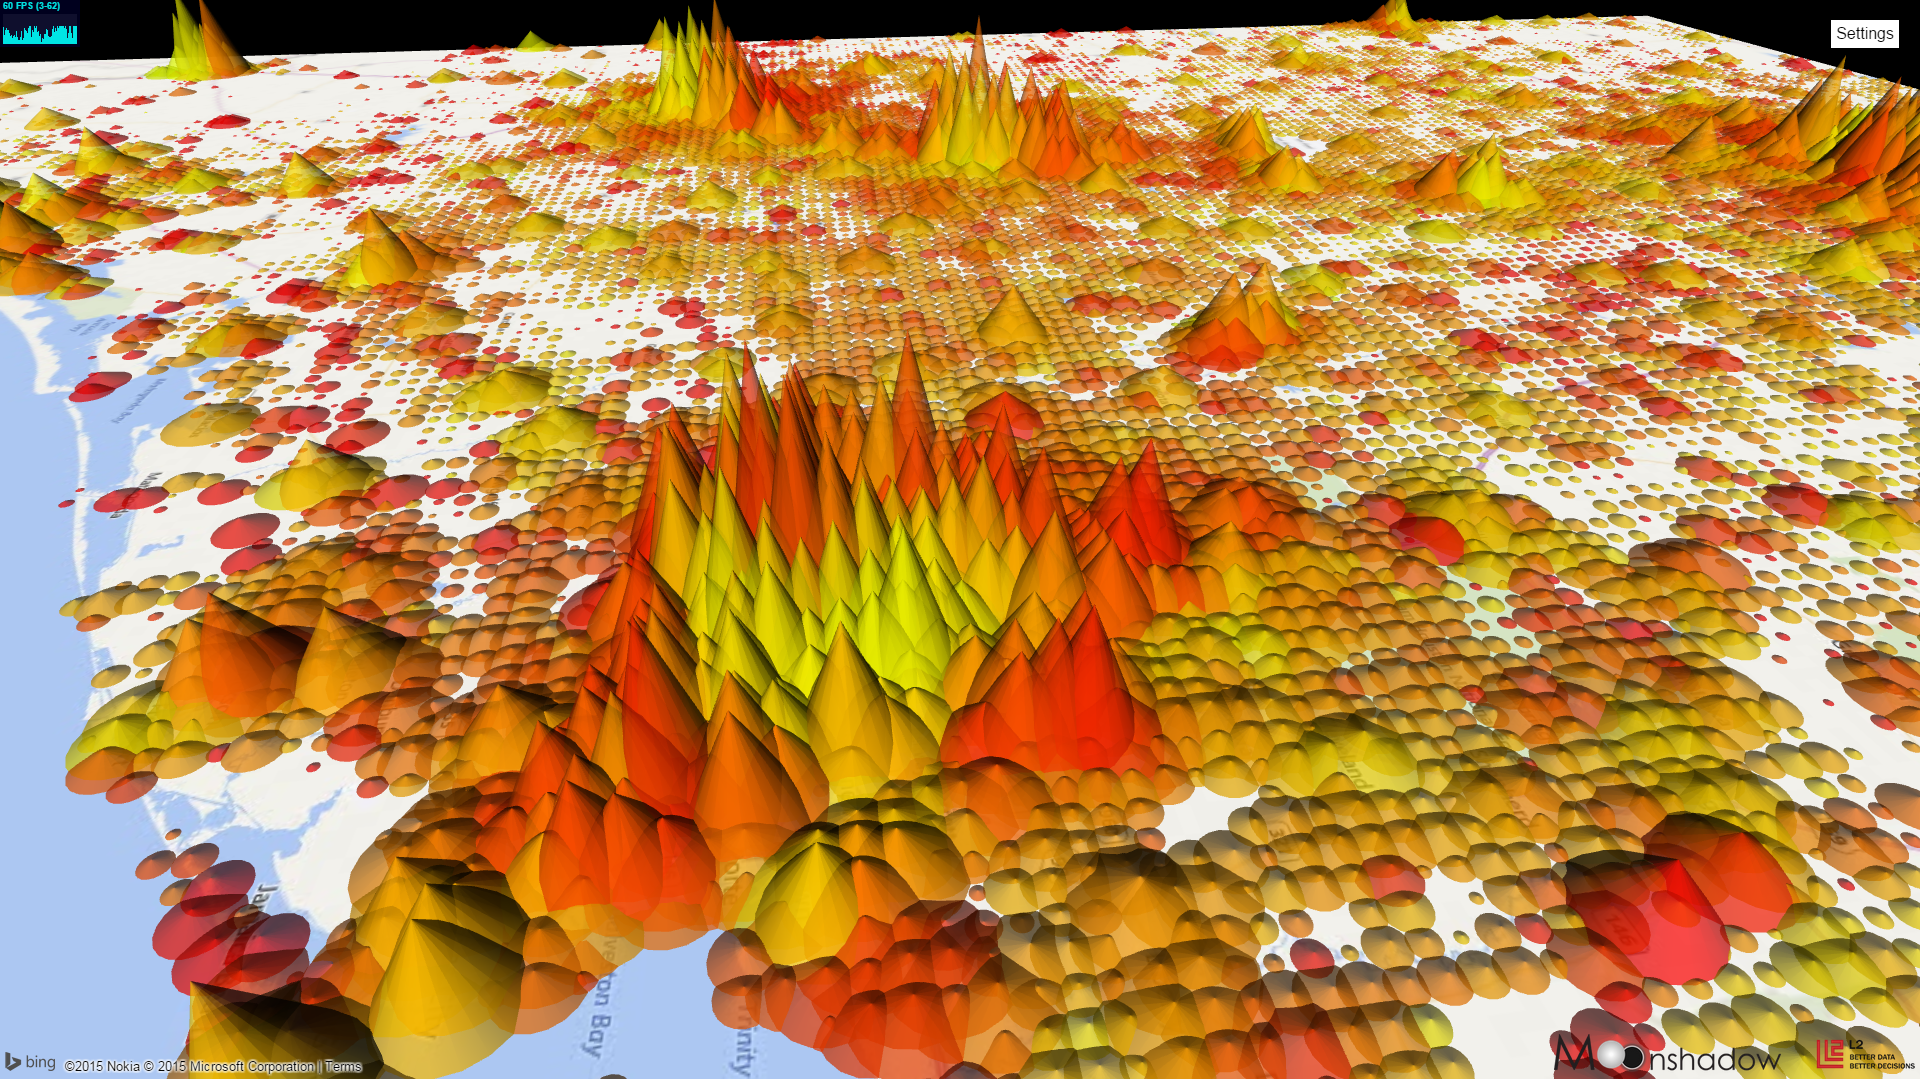
DB4IoT delivers cutting-edge database technology, interactive maps and analytics dashboards for public transit. This image shows the number of passengers on TriMet Bus Route #9 Westbound during Weekdays on Powell from the intersection of Powell and I5 all the way to Powell and 40th. The image was generated automatically from data that was recorded on every bus that ran on weekdays between May 31st 2017 and July 9th 2017. The X-axis shows the distance traveled in feet along Route #9. The Y-axis shows the time of day. The number of passengers is called the “Estimated Load” in TriMet’s lingo. The […]
 Gallery
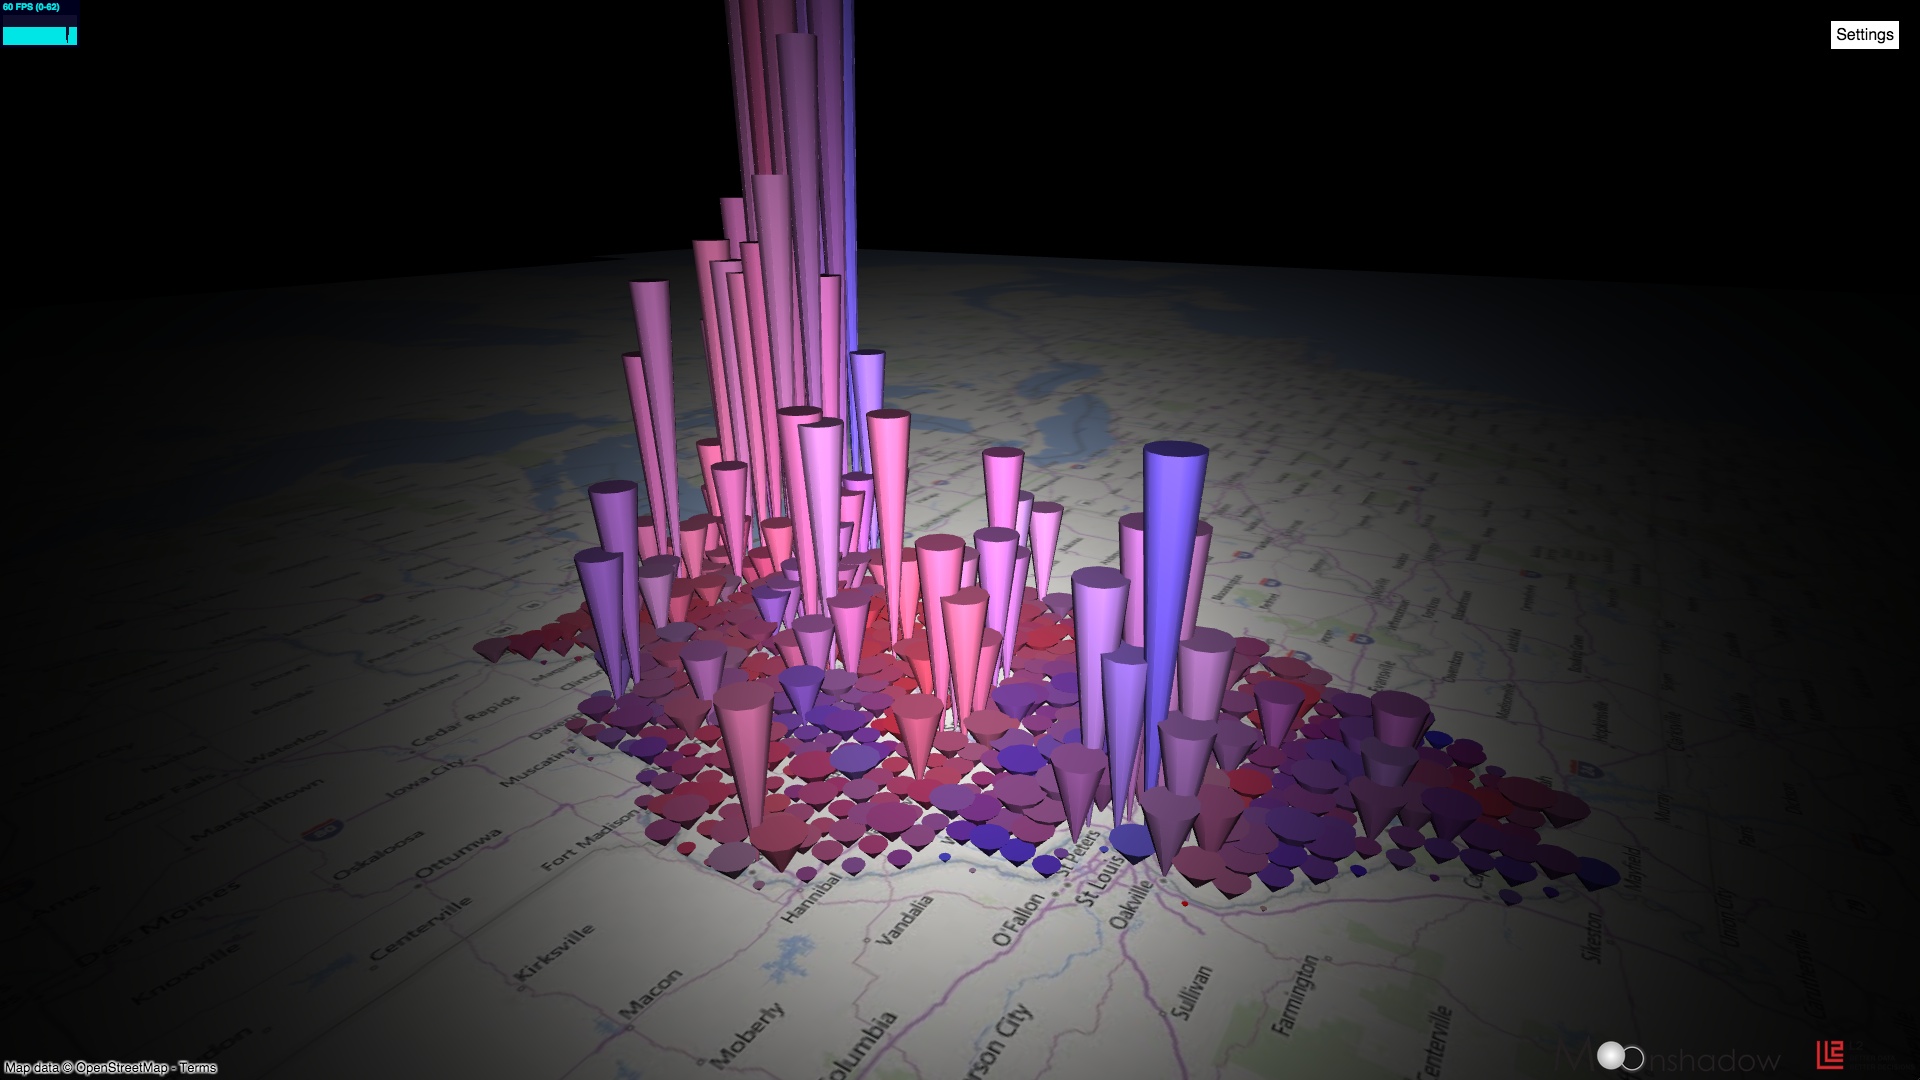
DB4IoT – Data Animations with Interactive Maps, Analytics and Dashboards for the Internet of Moving Things
Images
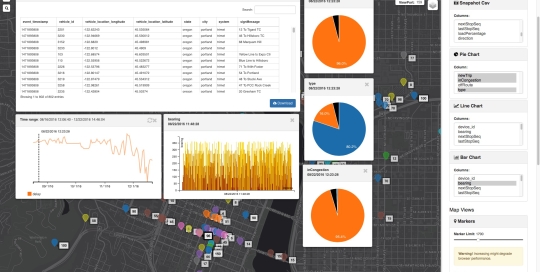
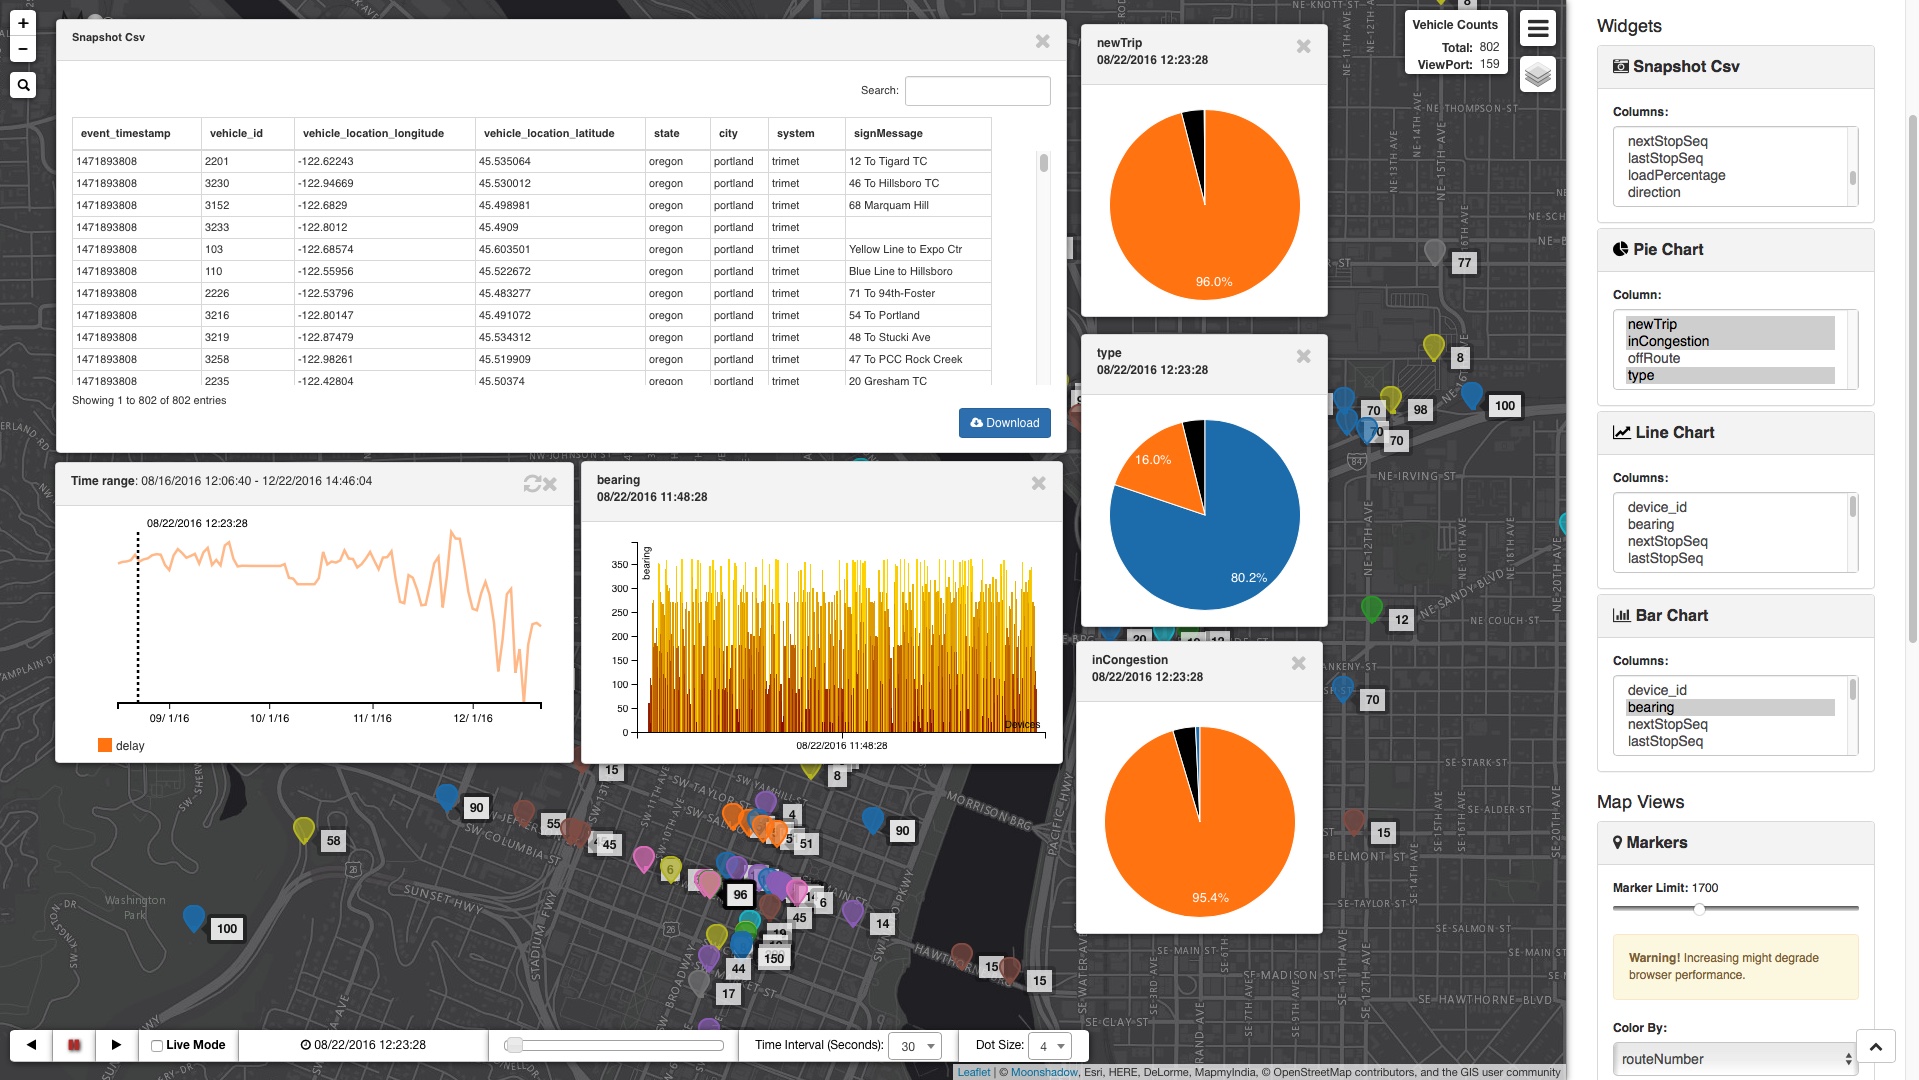
Visualize public transit data over interactive maps in real time and play back historical data animations with analytics and dashboards for the Internet of Moving Things – IoMT. DB4IoT delivers game-changing transit software analytics tools for transportation planners, transportation engineers and public transit agencies.
 Gallery
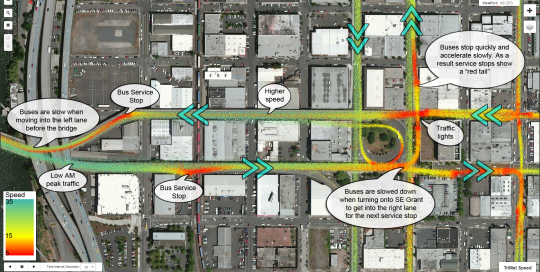
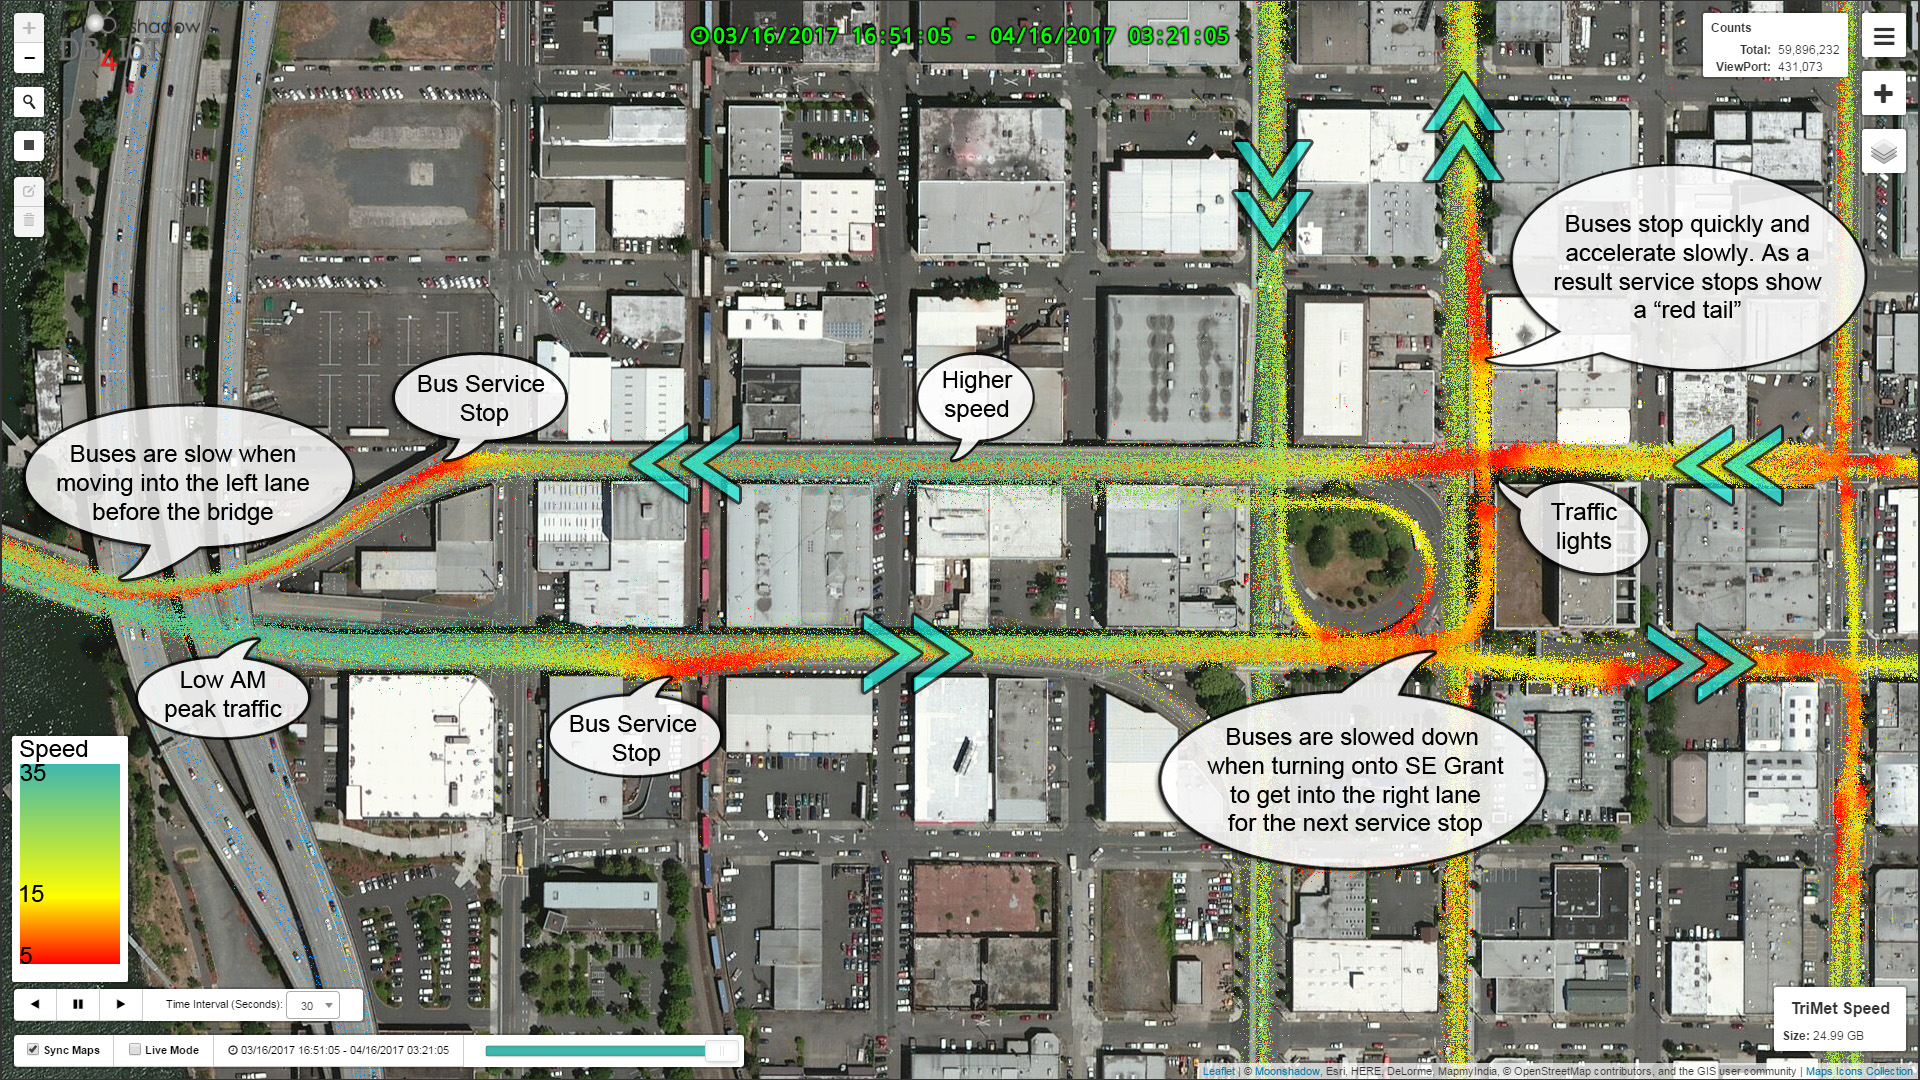
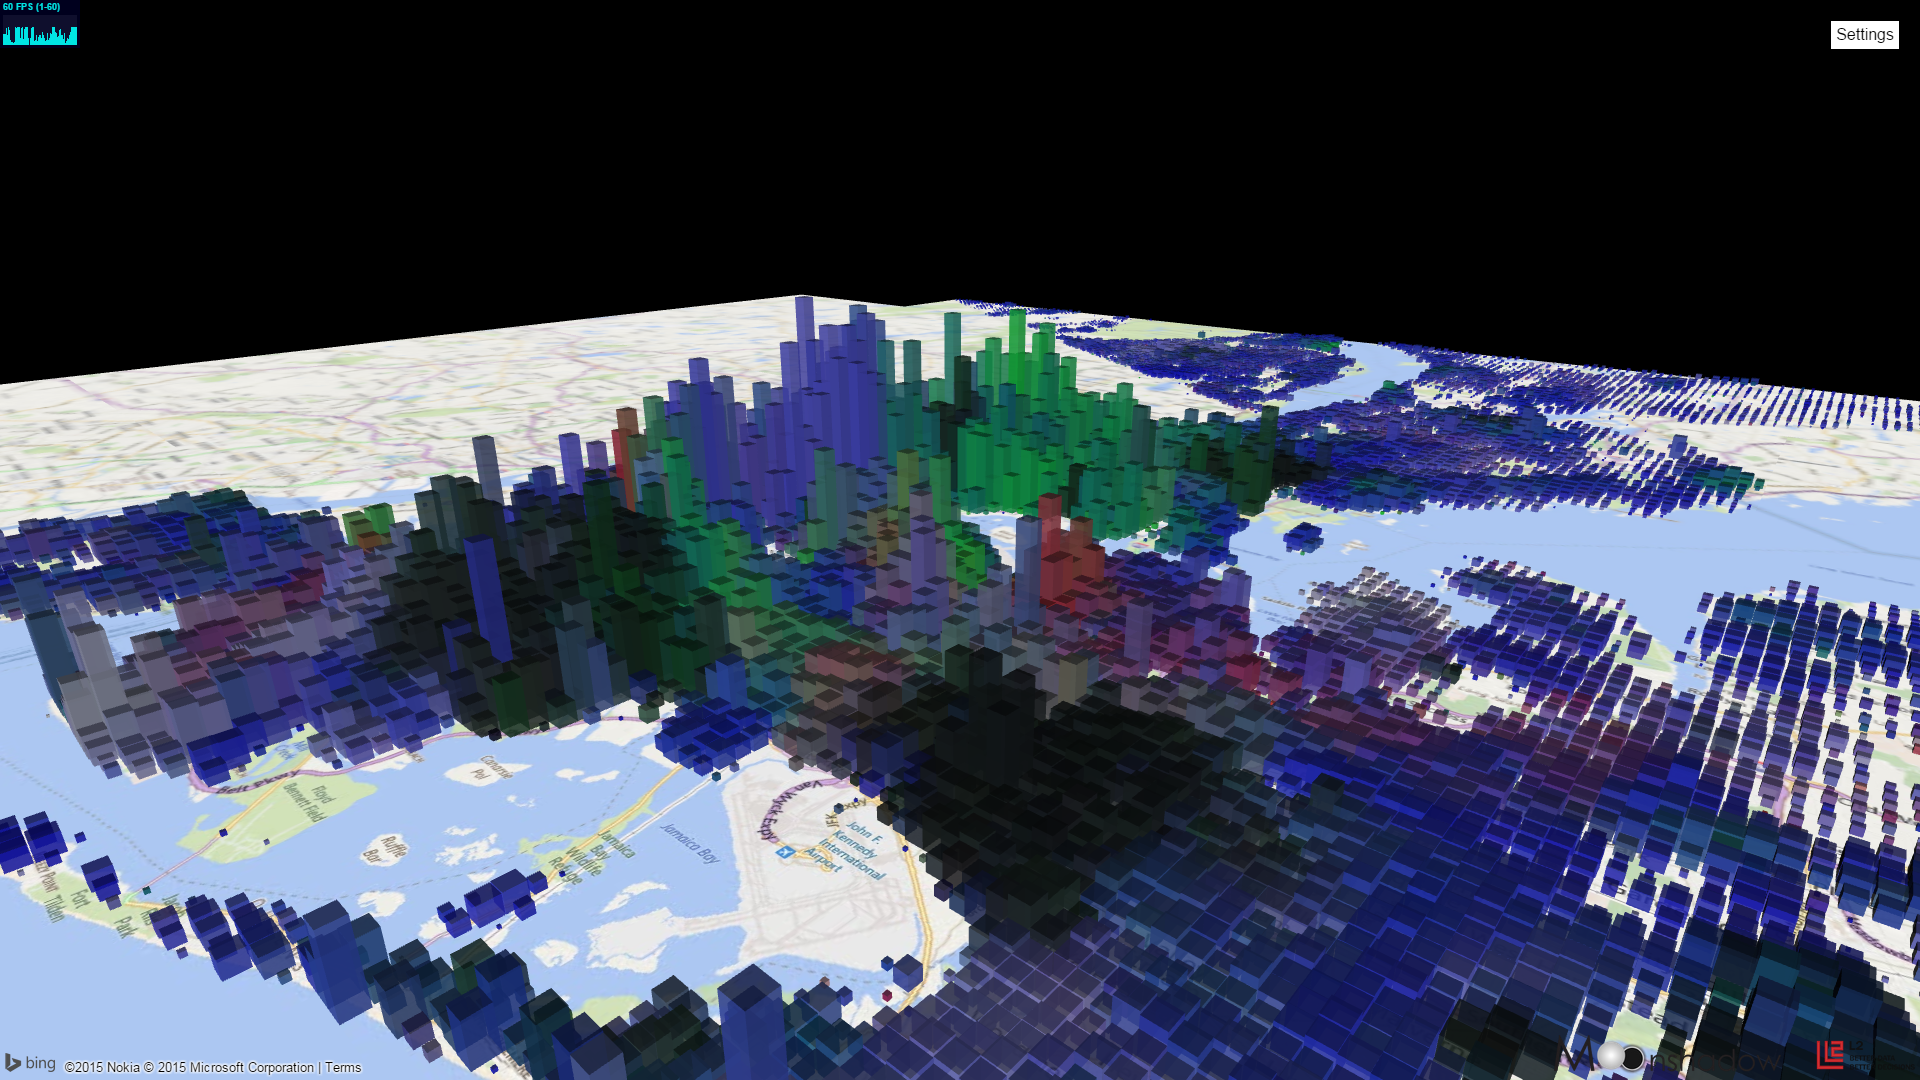
DB4IoT Route Analyst GTFS – Bus Speed Map
Images
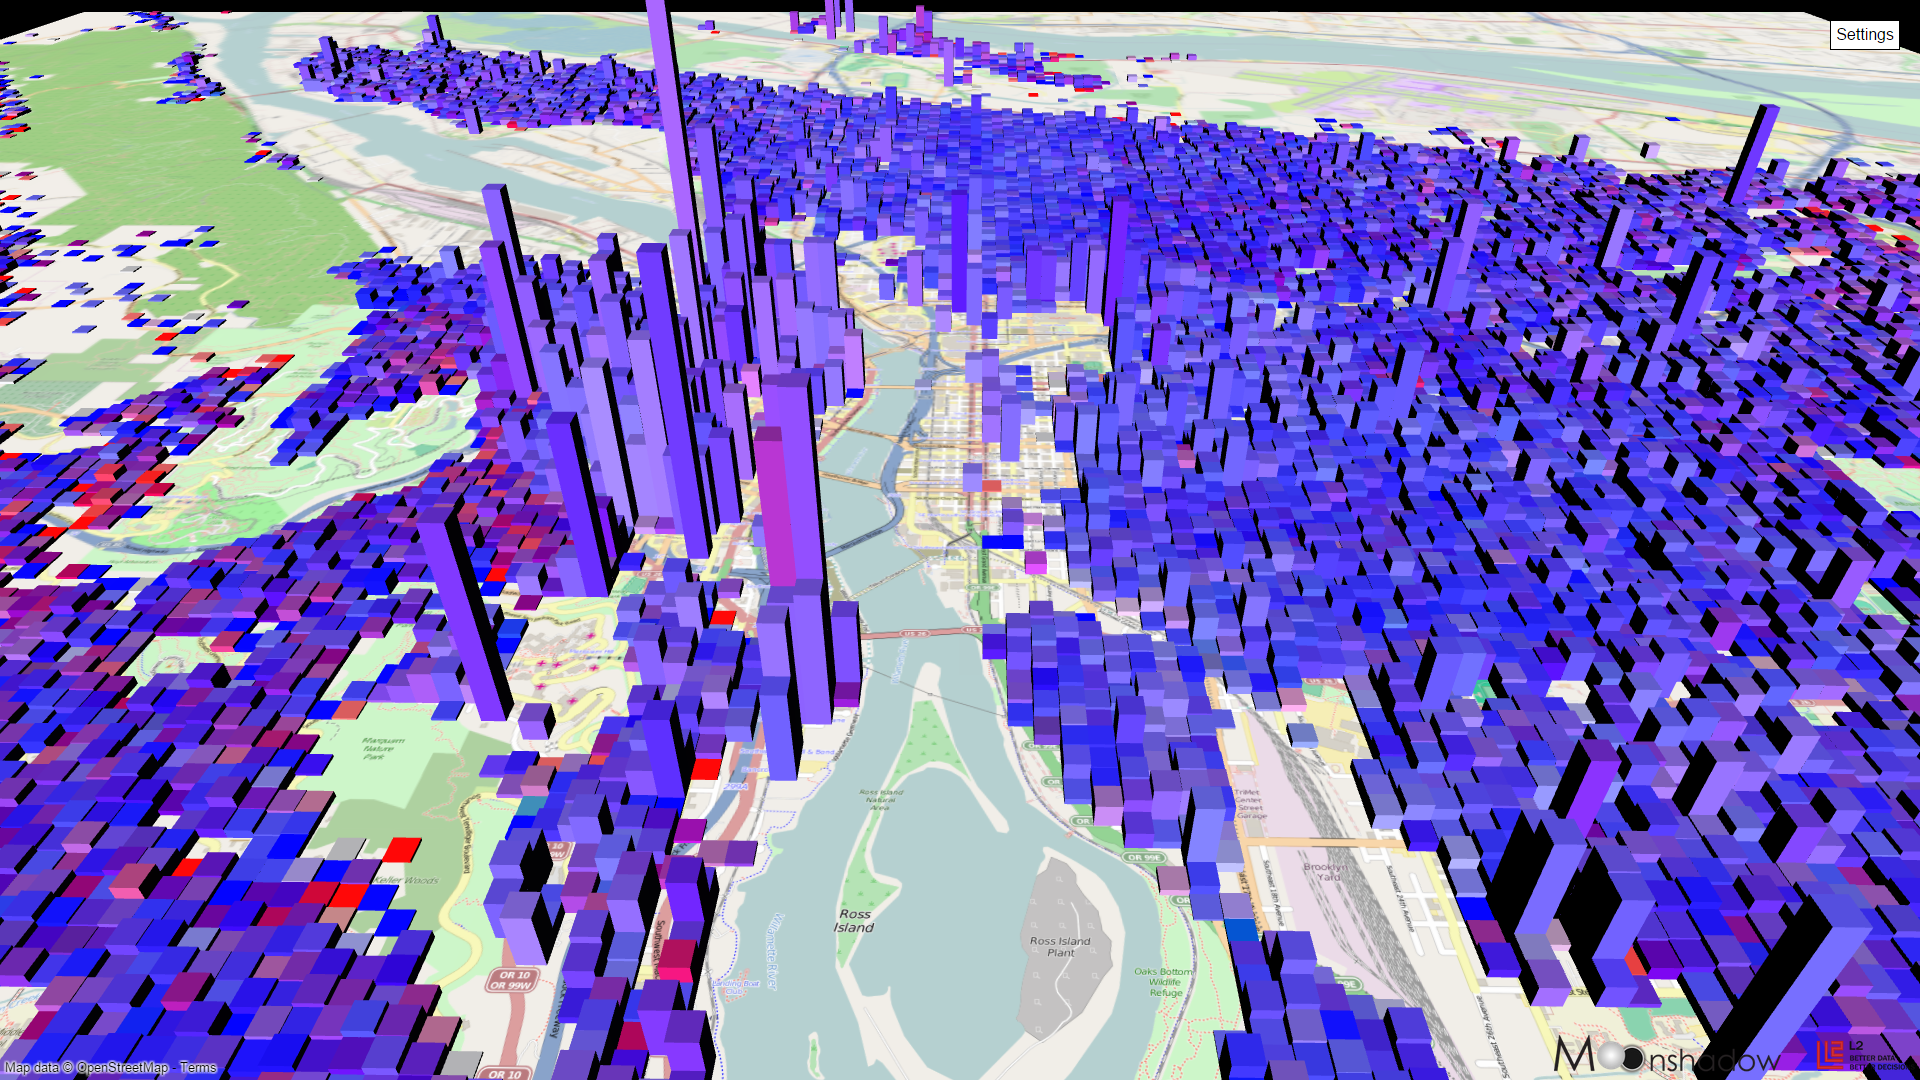
With DB4IoT Route Analyst GTFS public transit agencies can look at each individual route over time and maps simultaneously to analyze how driving speeds, travel delays, passenger loads and headway change. This helps public transit analytics software helps agencies identify bottlenecks and ways to improve them. DB4IoT Route Analyst GTFS and DB4IoT Route Analyst CAD/AVL are very powerful public transit analytics tools when discussing traffic improvements with cities, counties or funding agencies.
 Gallery
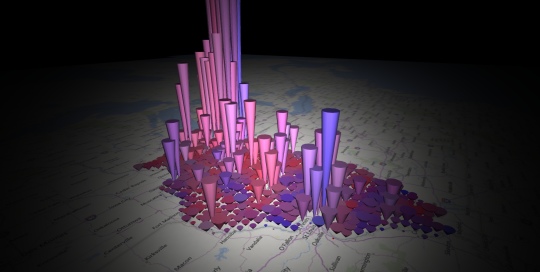
 Gallery
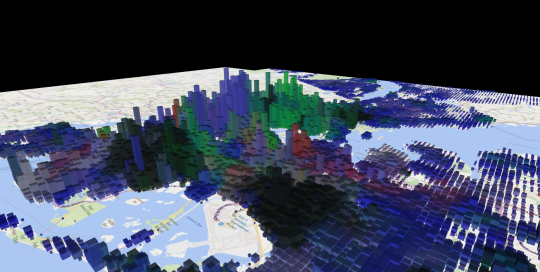
 Gallery
 Gallery
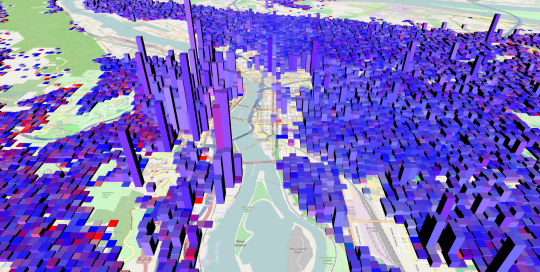
 Gallery