A Moonshadow Portfolio of Geospatial Visualization Images
Mouseover any of the images and click on the magnification icon to view the full-size image.

Mouseover any of the images and click on the magnification icon to view the full-size image.
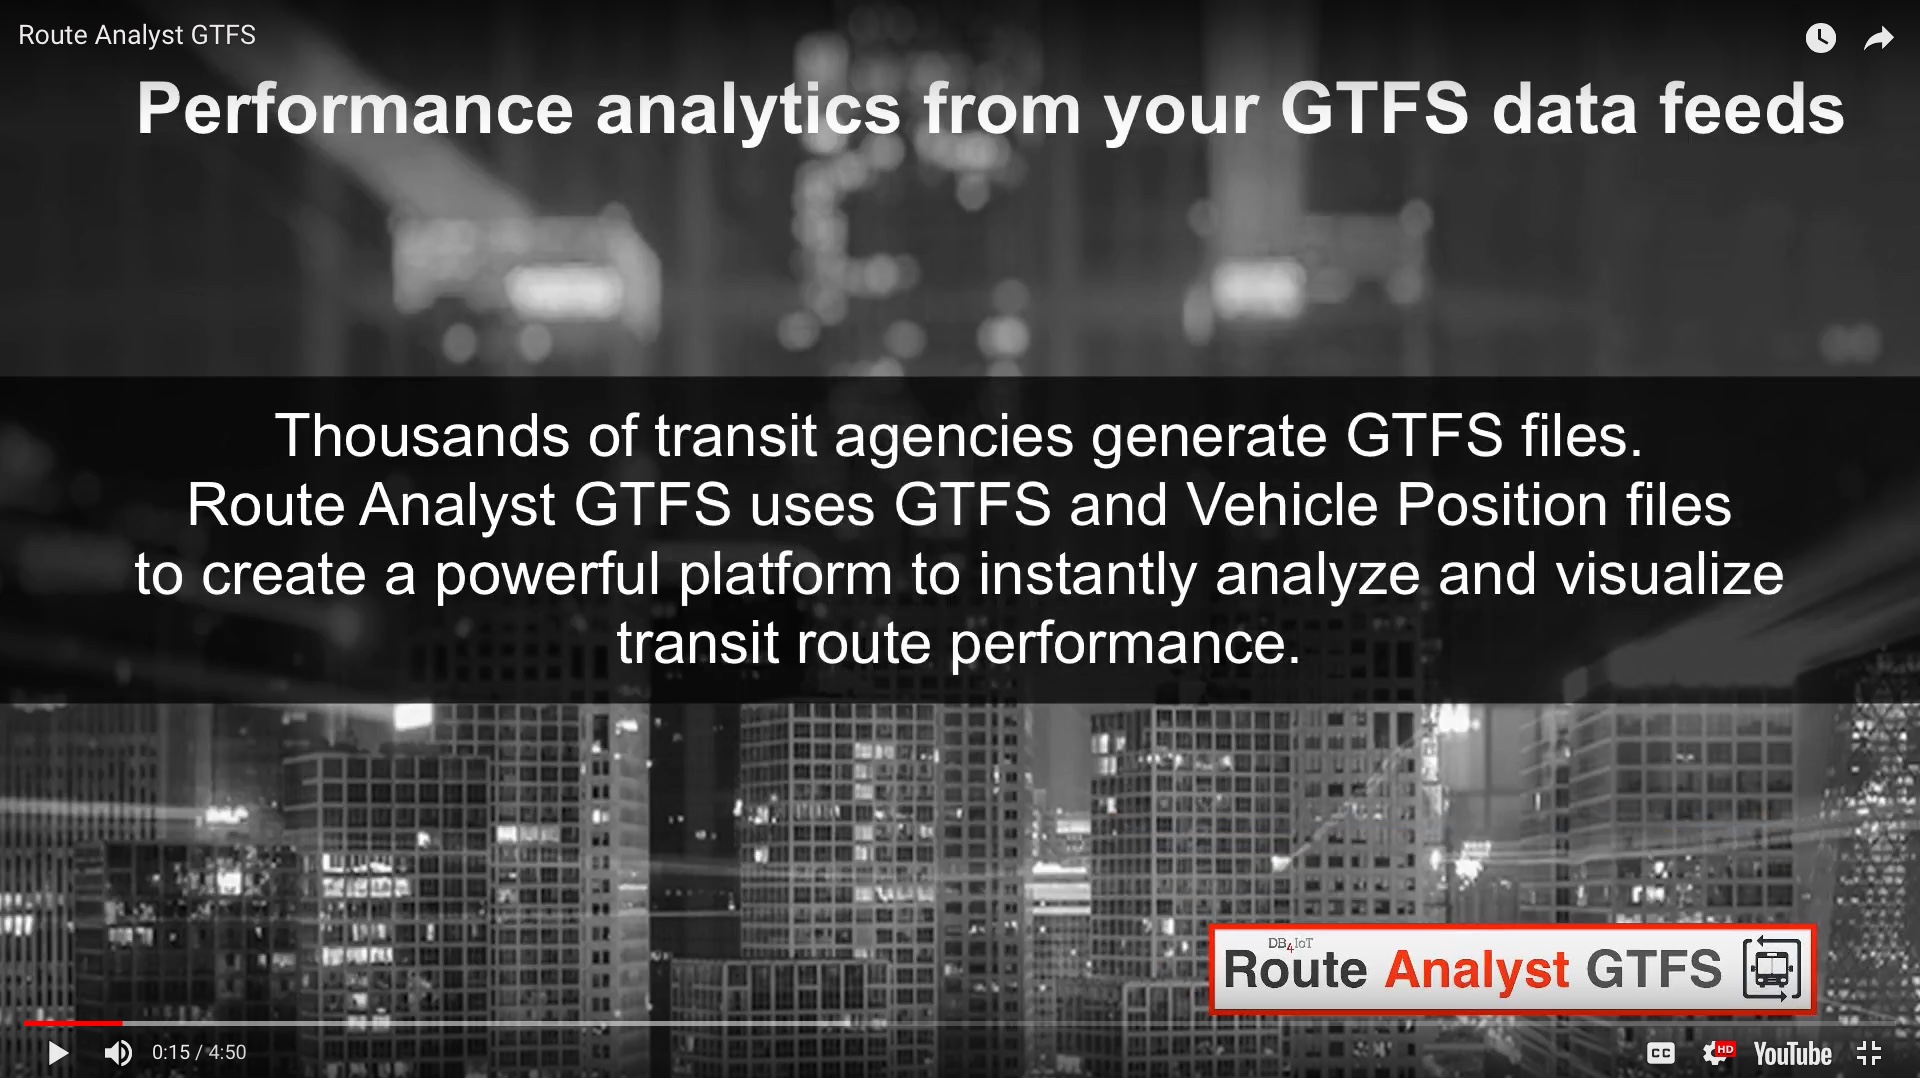
DB4IoT Route Analyst GTFS delivers performance analytics from your GTFS data feeds. DB4IoT Route Analyst GTFS is powered by DB4IoT – the database engine for the Internet of Moving Things.
DB4IoT Route Analyst GTFS creates speed, delay and headway maps, charts and graphs instantly from your GTFS and GTFS-RealTime feeds. Learn more db4iot.com/route-analyst-gtfs/
As a public transit agency you’ve invested millions of dollars in equipment to collect data. You’re collecting passenger counts, speeds, delays, location, movement and more on every bus every few seconds. This data is a gold mine of valuable information that could enable your transit agency to better track performance. But there’s so much data that you can’t easily and affordably make it available for instant analysis. With DB4IoT you can! Watch the video to learn more.
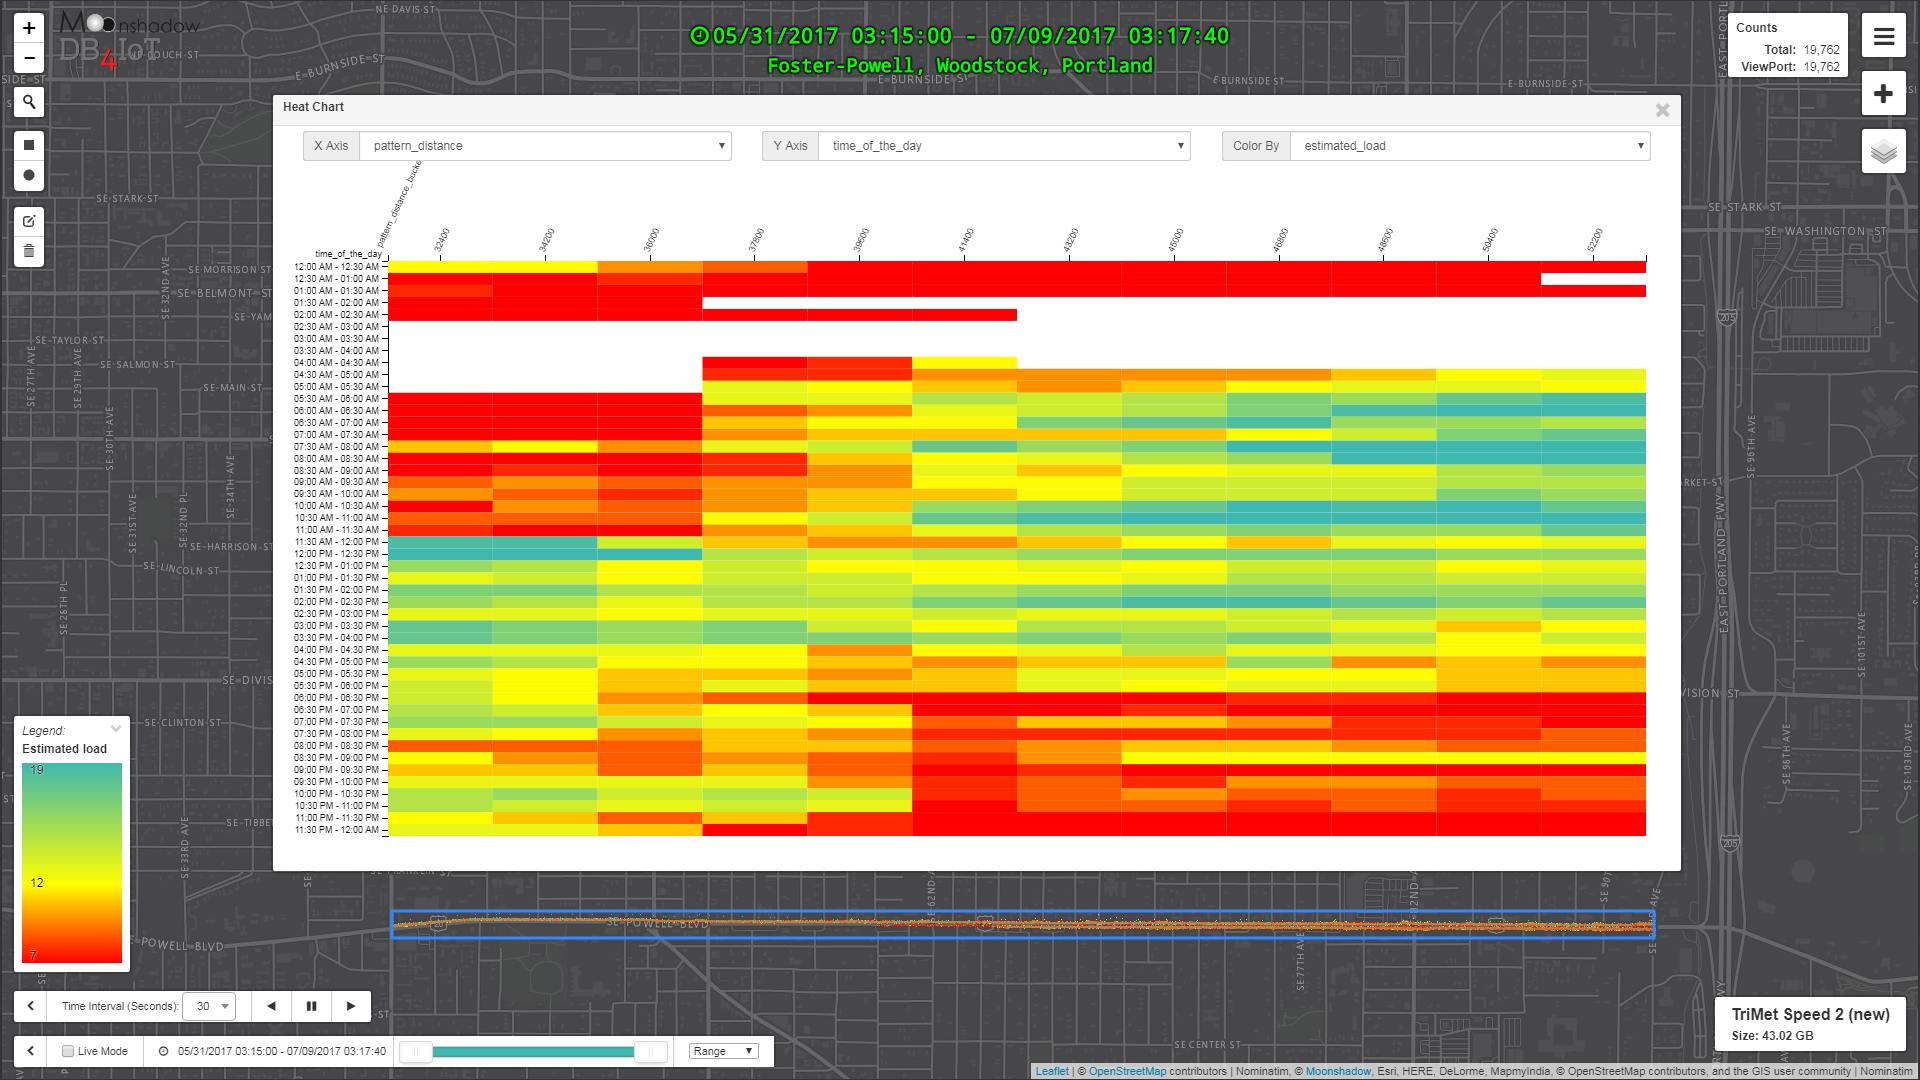
DB4IoT delivers cutting-edge database technology, interactive maps and analytics dashboards for public transit. This image shows the number of passengers on TriMet Bus Route #9 Westbound during Weekdays on Powell from the intersection of Powell and I5 all the way to Powell and 40th. The image was generated automatically from data that was recorded on every bus that ran on weekdays between May 31st 2017 and July 9th 2017. The X-axis shows the distance traveled in feet along Route #9. The Y-axis shows the time of day. The number of passengers is called the “Estimated Load” in TriMet’s lingo. The […]
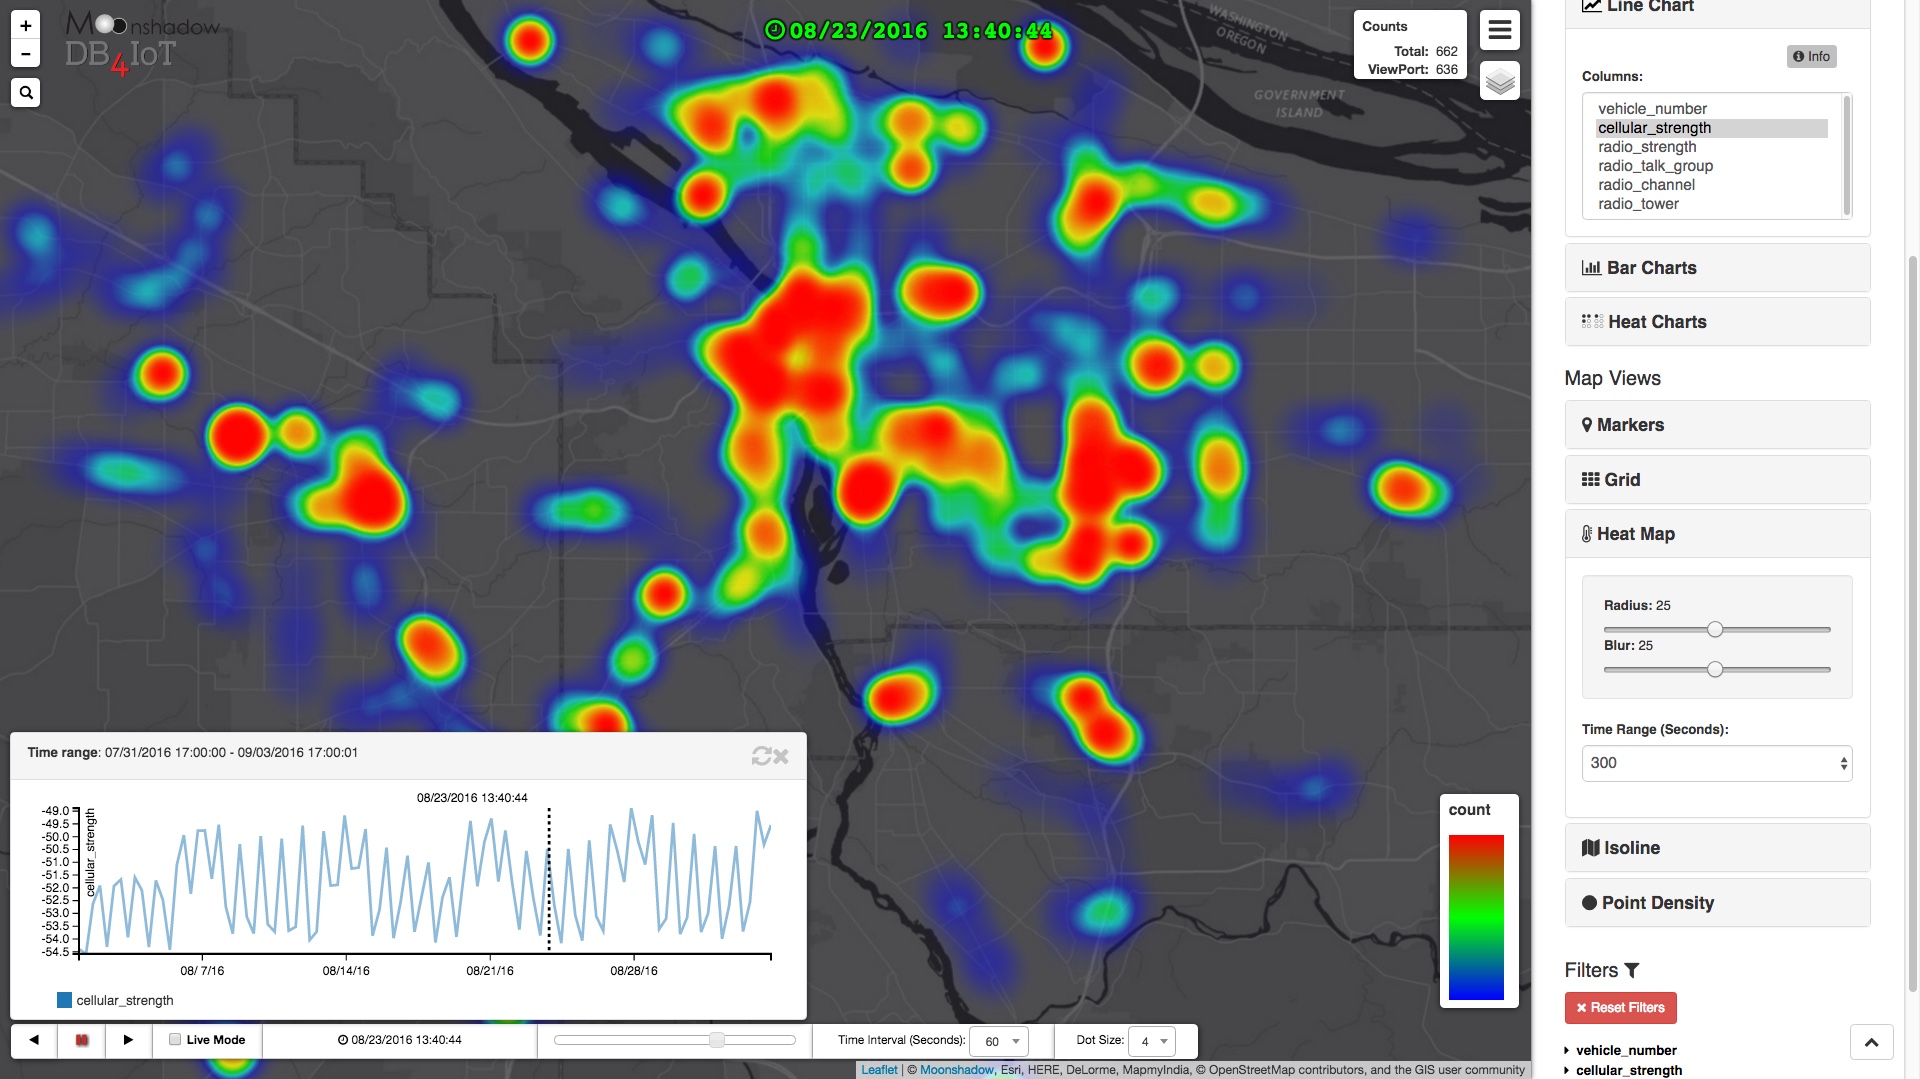
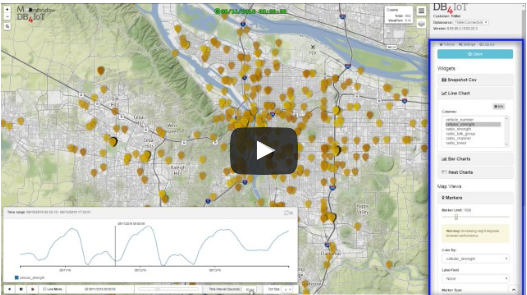
A cellular connectivity heat map screenshot taken from DB4IoT’s interactive public transit data analytics map and animation user interface. The connectivity situation can change minute-by-minute and day-by-day due to several contributing factors including weather, radio interference, the number of active connections to an individual cell tower, equipment automatically switching from one tower to another, overall network congestion, additions or reductions to the capacity of certain towers, various network changes implemented by cellular carriers and other factors. DB4IoT makes it fast and easy to analyze these changes.
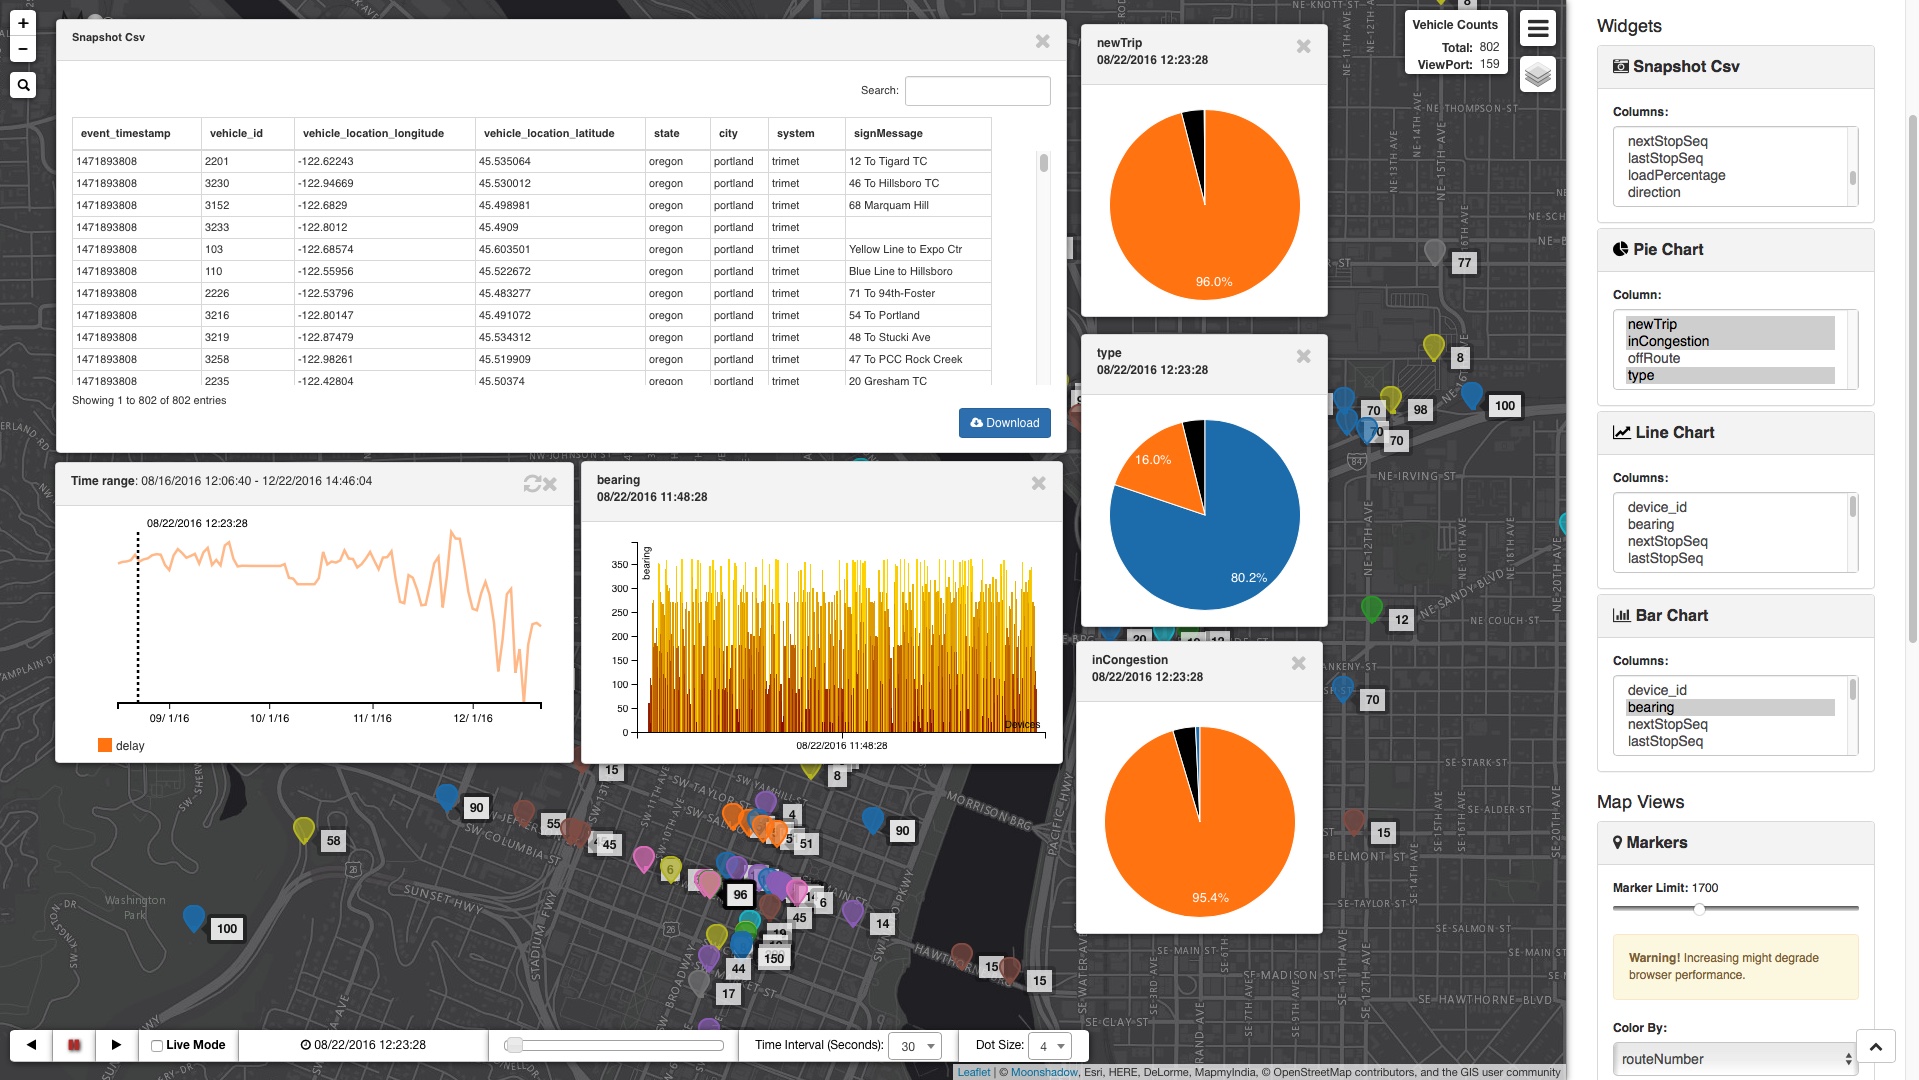
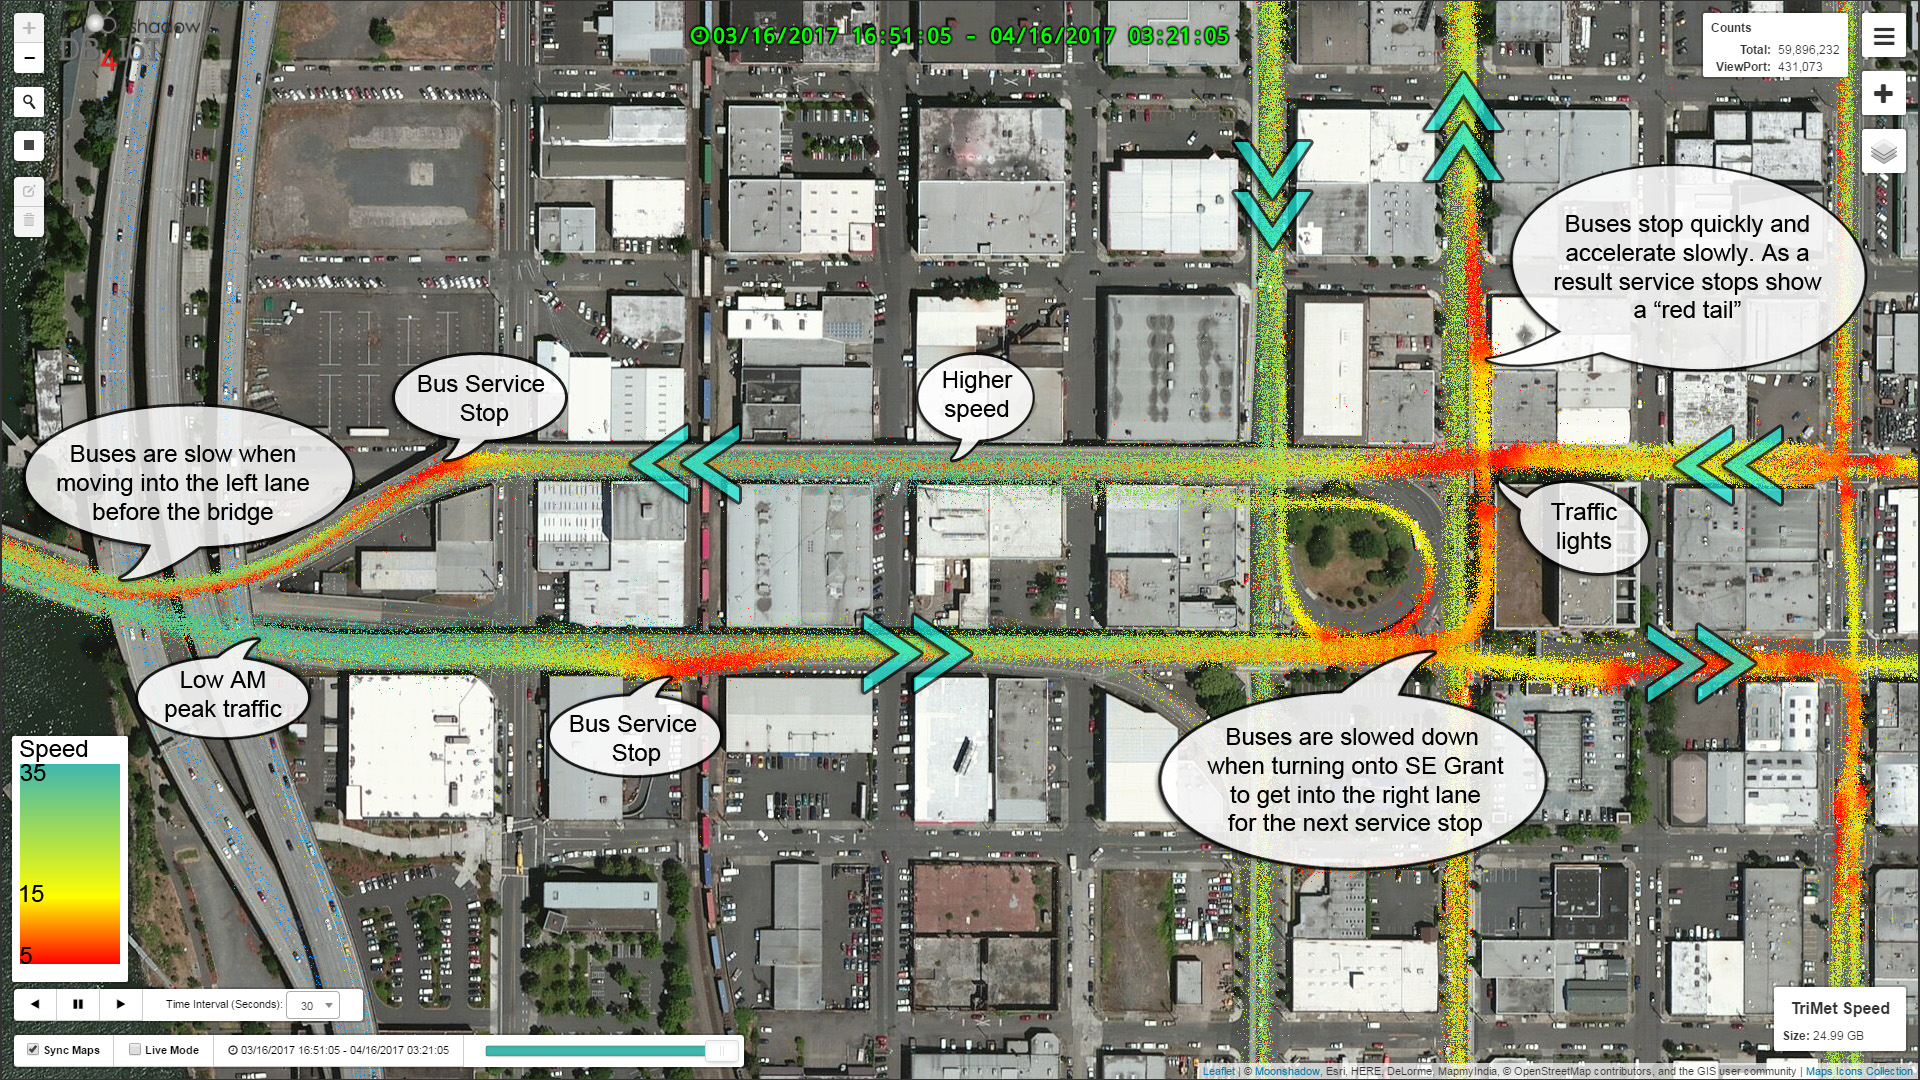
Visualize public transit data over interactive maps in real time and play back historical data animations with analytics and dashboards for the Internet of Moving Things – IoMT. DB4IoT delivers game-changing transit software analytics tools for transportation planners, transportation engineers and public transit agencies.
With DB4IoT Route Analyst GTFS public transit agencies can look at each individual route over time and maps simultaneously to analyze how driving speeds, travel delays, passenger loads and headway change. This helps public transit analytics software helps agencies identify bottlenecks and ways to improve them. DB4IoT Route Analyst GTFS and DB4IoT Route Analyst CAD/AVL are very powerful public transit analytics tools when discussing traffic improvements with cities, counties or funding agencies.
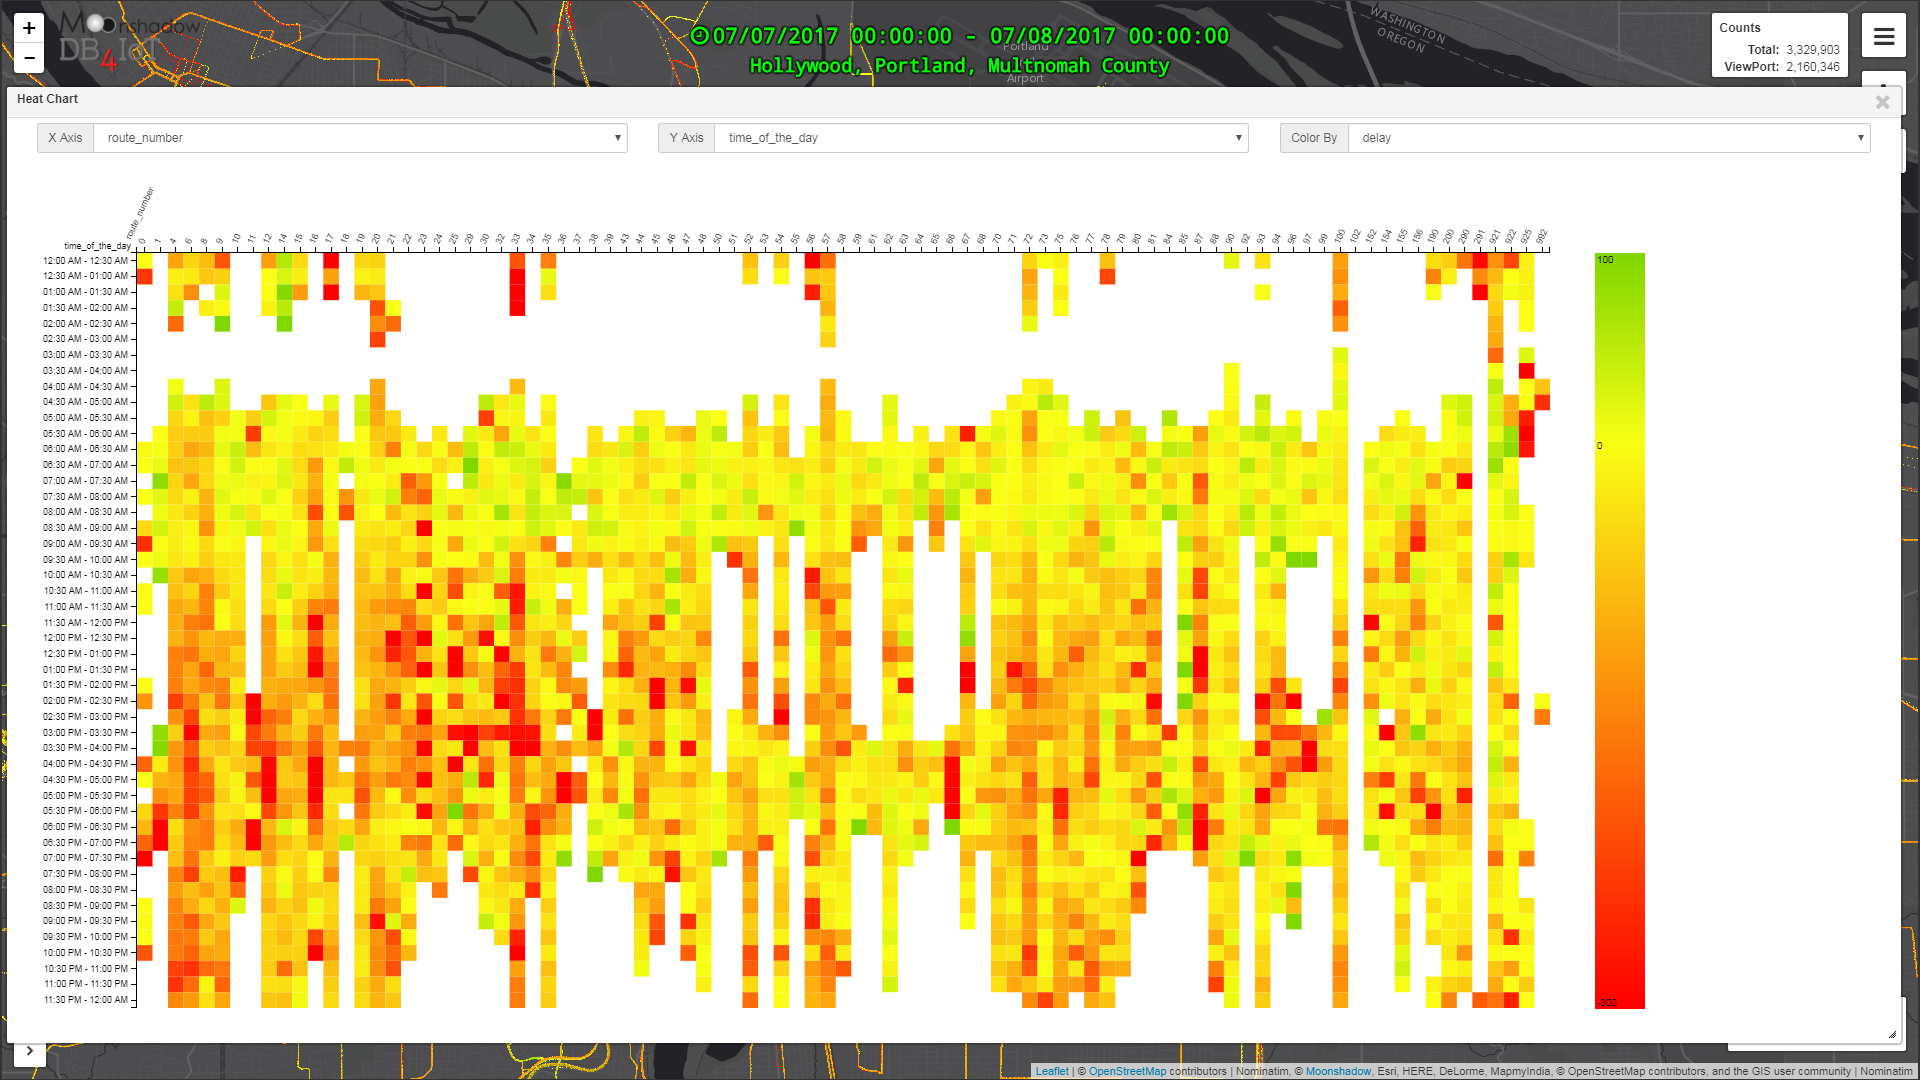
This heat chart image from DB4IoT Route Analyst GTFS shows the delays by route number and time of day for all TriMet buses on July 7, 2017.
Static cellular coverage and signal-strength maps can only approximate a basic overview. DB4IoT not only provides up-to-date, real-time performance maps but users can also pick any slice of time to view, visualize and analyze historical cellular performance in “playback” mode. DB4IoT’s Internet of Moving Things software allows you to compare fluctuating cellular performance levels encompassing the range of real-world situations your moving vehicles experience every day.
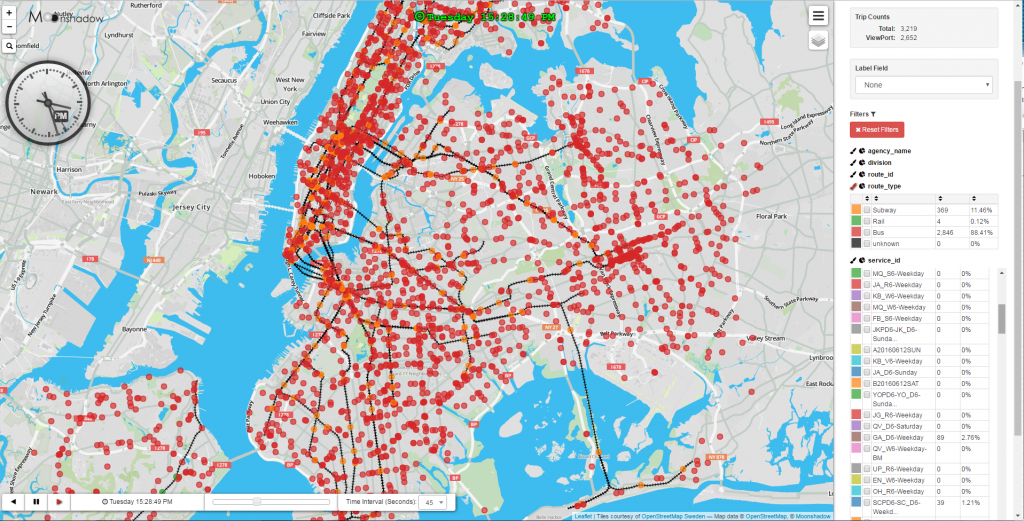
Each week the buses and trains of the New York City Metropolitan Transportation Authority (MTA) make over 150,000 trips. We thought it would be fun to visualize all these trips in an “animated map application”. The MTA animated map application shows the scheduled location of every bus and subway train at any time during the week over a map. This is another example of DB4IoT Internet of Moving Things software in action.