Data Mapping & Visualization

ITS Washington Annual Meeting Presentation – Using Connected Vehicle Data to Estimate Greenhouse Gas Emissions

By |December 19th, 2018|

Eimar Boesjes, Moonshadow CEO, delivered a technical presentation at the ITS Washington annual meeting on December 11th, 2018 in Seattle.

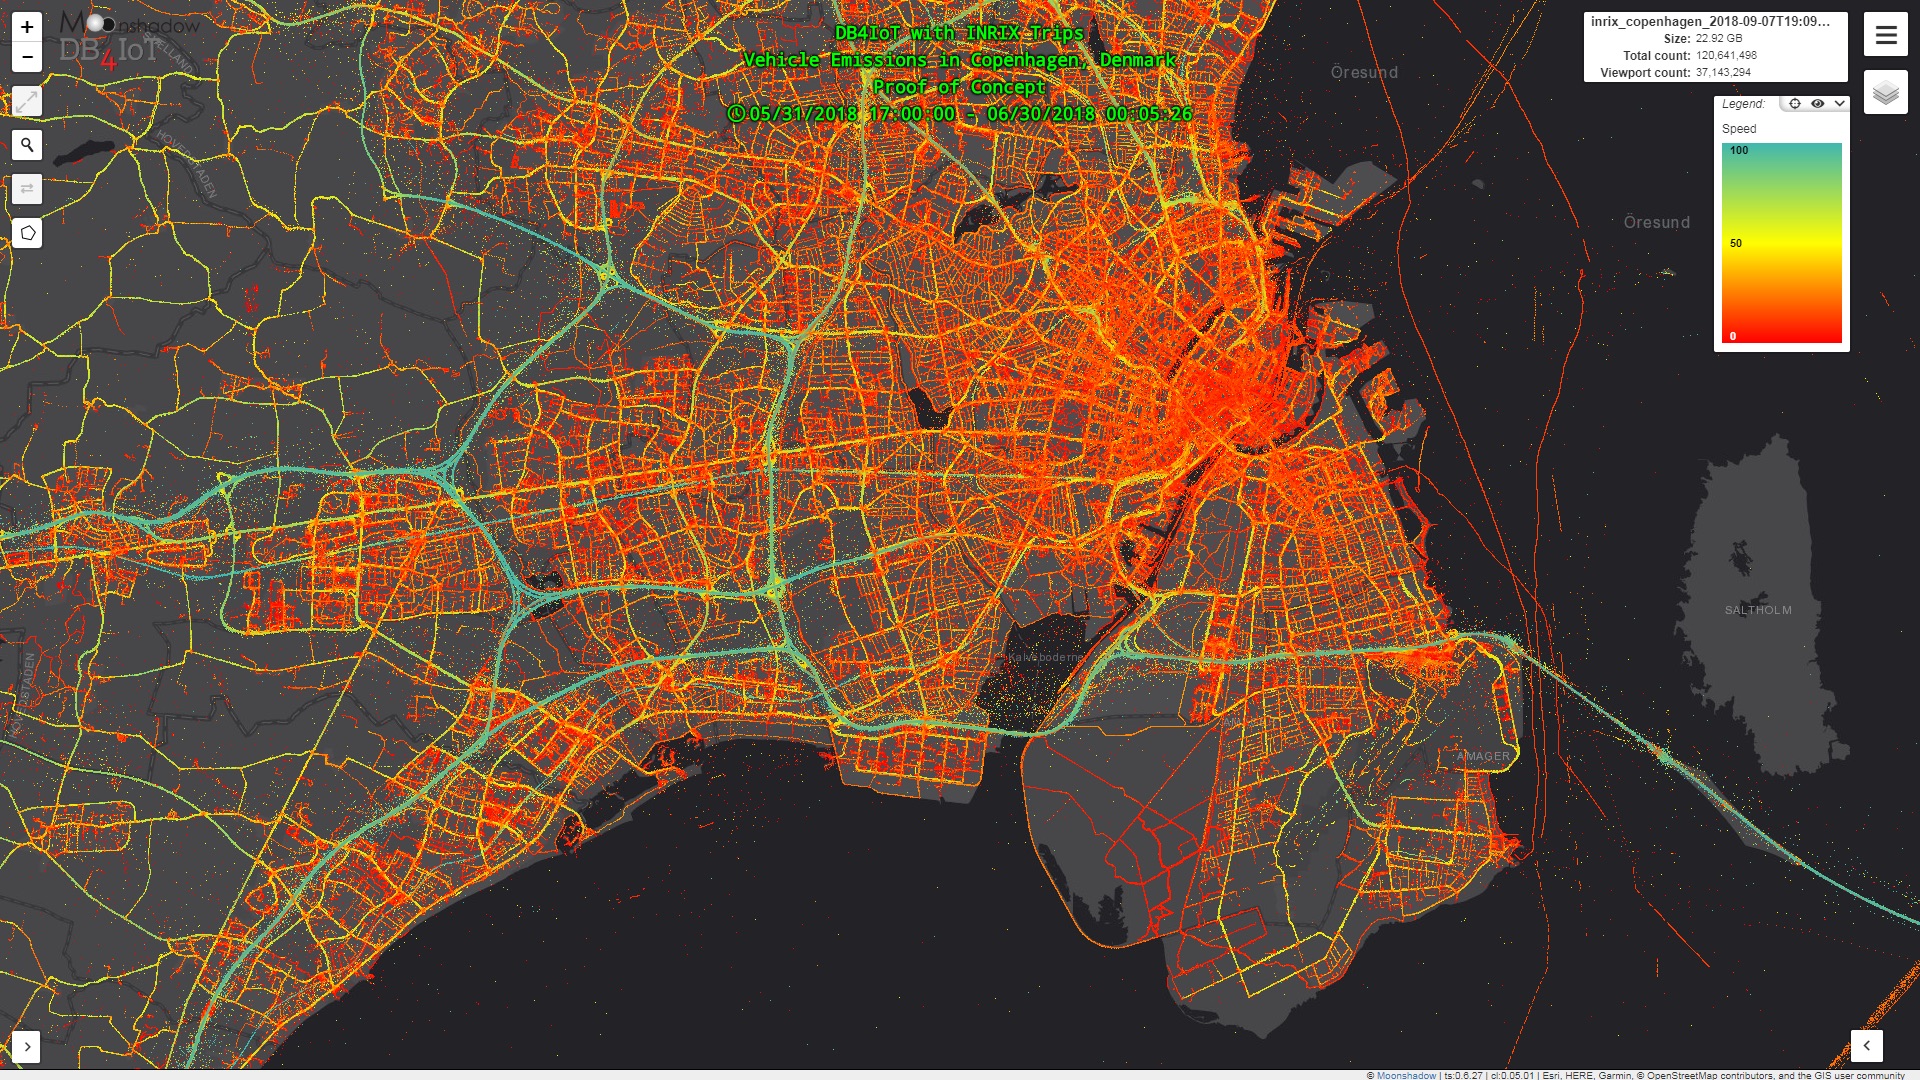
Estimating vehicle emissions from connected vehicle data does not replace existing environmental models, roadside emissions measurements or environmental models. Rather, it augments these. We think it would be extremely interesting to compare the emissions estimates from DB4IoT with INRIX Trips with actual measurements from roadside air quality measurements, with emissions calculations from gasoline sales and with the existing environmental models. These different approaches each give a different insight and they can be used to ‘ground truth’ each other.

For additional background information […]

Deriving Greenhouse Gas Emissions Estimates from Connected Vehicle Data

By |October 31st, 2018|

Eimar M. Boesjes, CEO, Moonshadow Mobile
Joshua Skov, Industry Mentor, Lundquist College of Business, University of Oregon
October 26, 2018

What does the carbon footprint from transportation look like? In particular, how could you map it?

Typically, carbon footprinting exercises for local and regional jurisdictions deliver highly aggregated results. Even when the unit of analysis is geographic, the data is all about pie charts and tables. The results for New York City are…for all of New York City. Meaningful and important, but it leaves us missing something truly geographic in nature. Moonshadow Mobile recently completed a proof of concept (PoC) to derive greenhouse gas […]

Moonshadow Mobile Partners with INRIX to Deliver Powerful Travel Pattern Analytics Platform

By |June 4th, 2018|

Novi, MI – June 4, 2018 – Today, Moonshadow Mobile, Inc. announced a partnership with INRIX, the world leader in transportation analytics and connected car services, to incorporate INRIX Trips Reports into Moonshadow’s DB4IoT platform. The solution offers transportation agencies an intuitive, cloud- based origin-destination analytics platform for understanding the trips consumers and fleets make over time on maps, charts, graphs and animations.

“DB4IoT with INRIX Trips transforms and optimizes operations for departments of transport and public transit agencies, informs short- and long-term transportation planning and engineering efforts, and unleashes the potential of connected vehicle data,” said Eimar Boesjes, CEO at […]

L2 VoterMapping – Powered by Moonshadow – Used by CBS News and NY Times

By |February 24th, 2016|

L2 VoterMapping and is being used by CBS News and the New York Times as a tool to enhance their 2016 election coverage.

L2 VoterMapping is a voter analysis and data selection tool unlike any other. VoterMapping technology – powered by Moonshadow’s Ephemeris database technology – arms candidates, consultants, pollsters, political organizations, academic researchers, public affairs professionals and government agencies and more with data visualization and analysis capabilities unavailable anywhere else. Display and analyze millions of records instantly, visualizing your result geo-spatially with Bing Maps…all in real time.

The combination of the most accurately processed voter data available and the speed of […]

Ethnicity in the US in 3D

By |March 27th, 2015|

Ethnic groups in the US are distributed unevenly across the nation. The animations below show where they are located and how large they are in relationship to each other.  We looked at five different broad ethnic groups: Europeans, East & South Asians, Hispanic and Portuguese and African American.  The ‘Other’ group includes all other groups including Native Americans.  We used the registered voter data from L2 Political to do this ethnic analysis.
[…]

Ephemeris Database Technology – Overview Video

By |March 20th, 2015|

Moonshadow’s patented Ephemeris database technology delivers blazing-fast data access speeds, shrinks your big data footprint by as much as 90% and reduces the number of servers required to run your big data by 90%. Check out this video for a high-level overview of what Ephemeris is all about.