
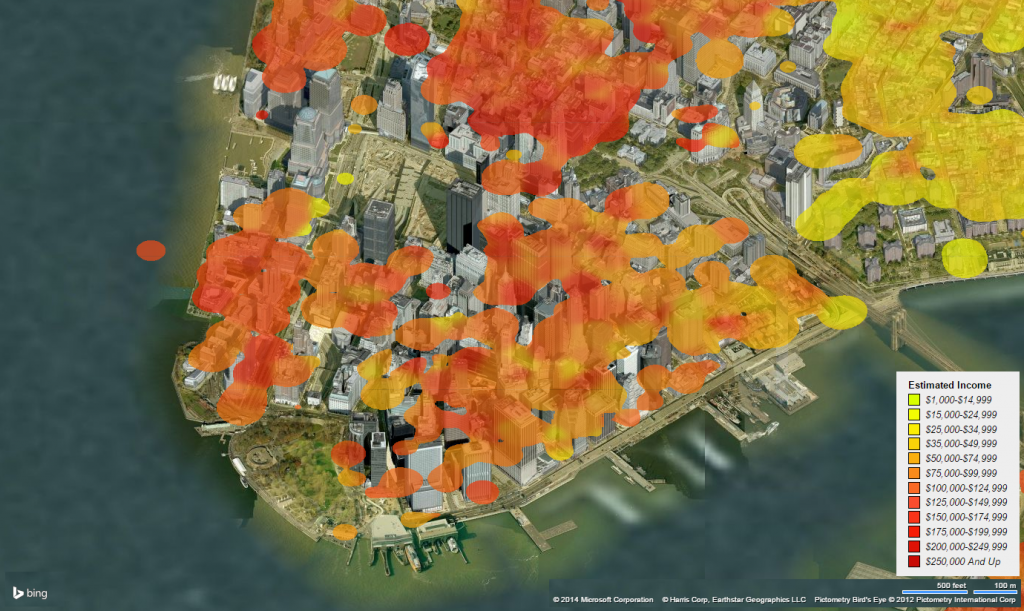
Income in Manhattan projected over Aerial Photos
Moonshadow’s Eimar Boesjes (COO/CTO) was a featured speaker at last month’s VISUALIZED.io conference in London, presenting examples of Moonshadow’s latest big data visualizations. Kenneth Cukier, Data Editor for The Economist, was in attendance and penned an online article using one of Moonshadow’s visualizations (shown above) as a featured image.
Cukier’s article identifies an interesting trend about how data visualization is changing to encompass online interactive data that is alive, relegating static data visualizations as less relevant relics of the past. This evolution has been accelerated by the ubiquity of computers, tablets, smartphones and Internet-connected digital devices. It’s an interesting read at The Economist titled “The quick and the dead”.
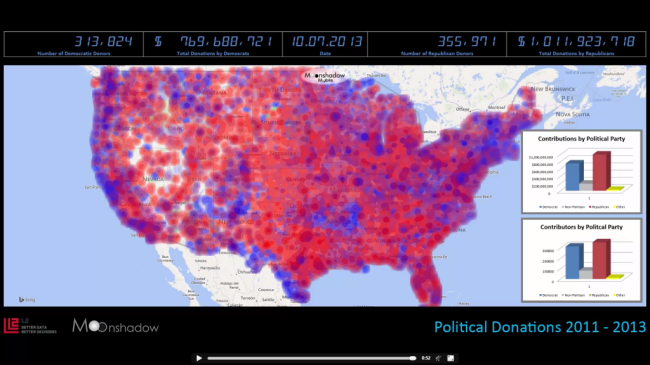
Political Contributions by US Registered Voters 2011-2013
Boesjes presented several examples of Moonshadow’s work in London including the animation above which details political contributions of almost $2 billion made by more than 600,000 voters in the U.S. from 2011 through 2013. The data for this animation comes from L2’s database of 160 million registered U.S. voters available in VoterMapping. Click the image to watch the video.
At Moonshadow we’re gratified to see our data visualization work recognized in The Economist by Cukier, a respected author, speaker and authority in the world of big data.


