
The images below show income levels in Manhattan overlaid on aerial photo’s. The income levels are shown from yellow for the lower incomes to red for the highest incomes. Click on the images to zoom in.
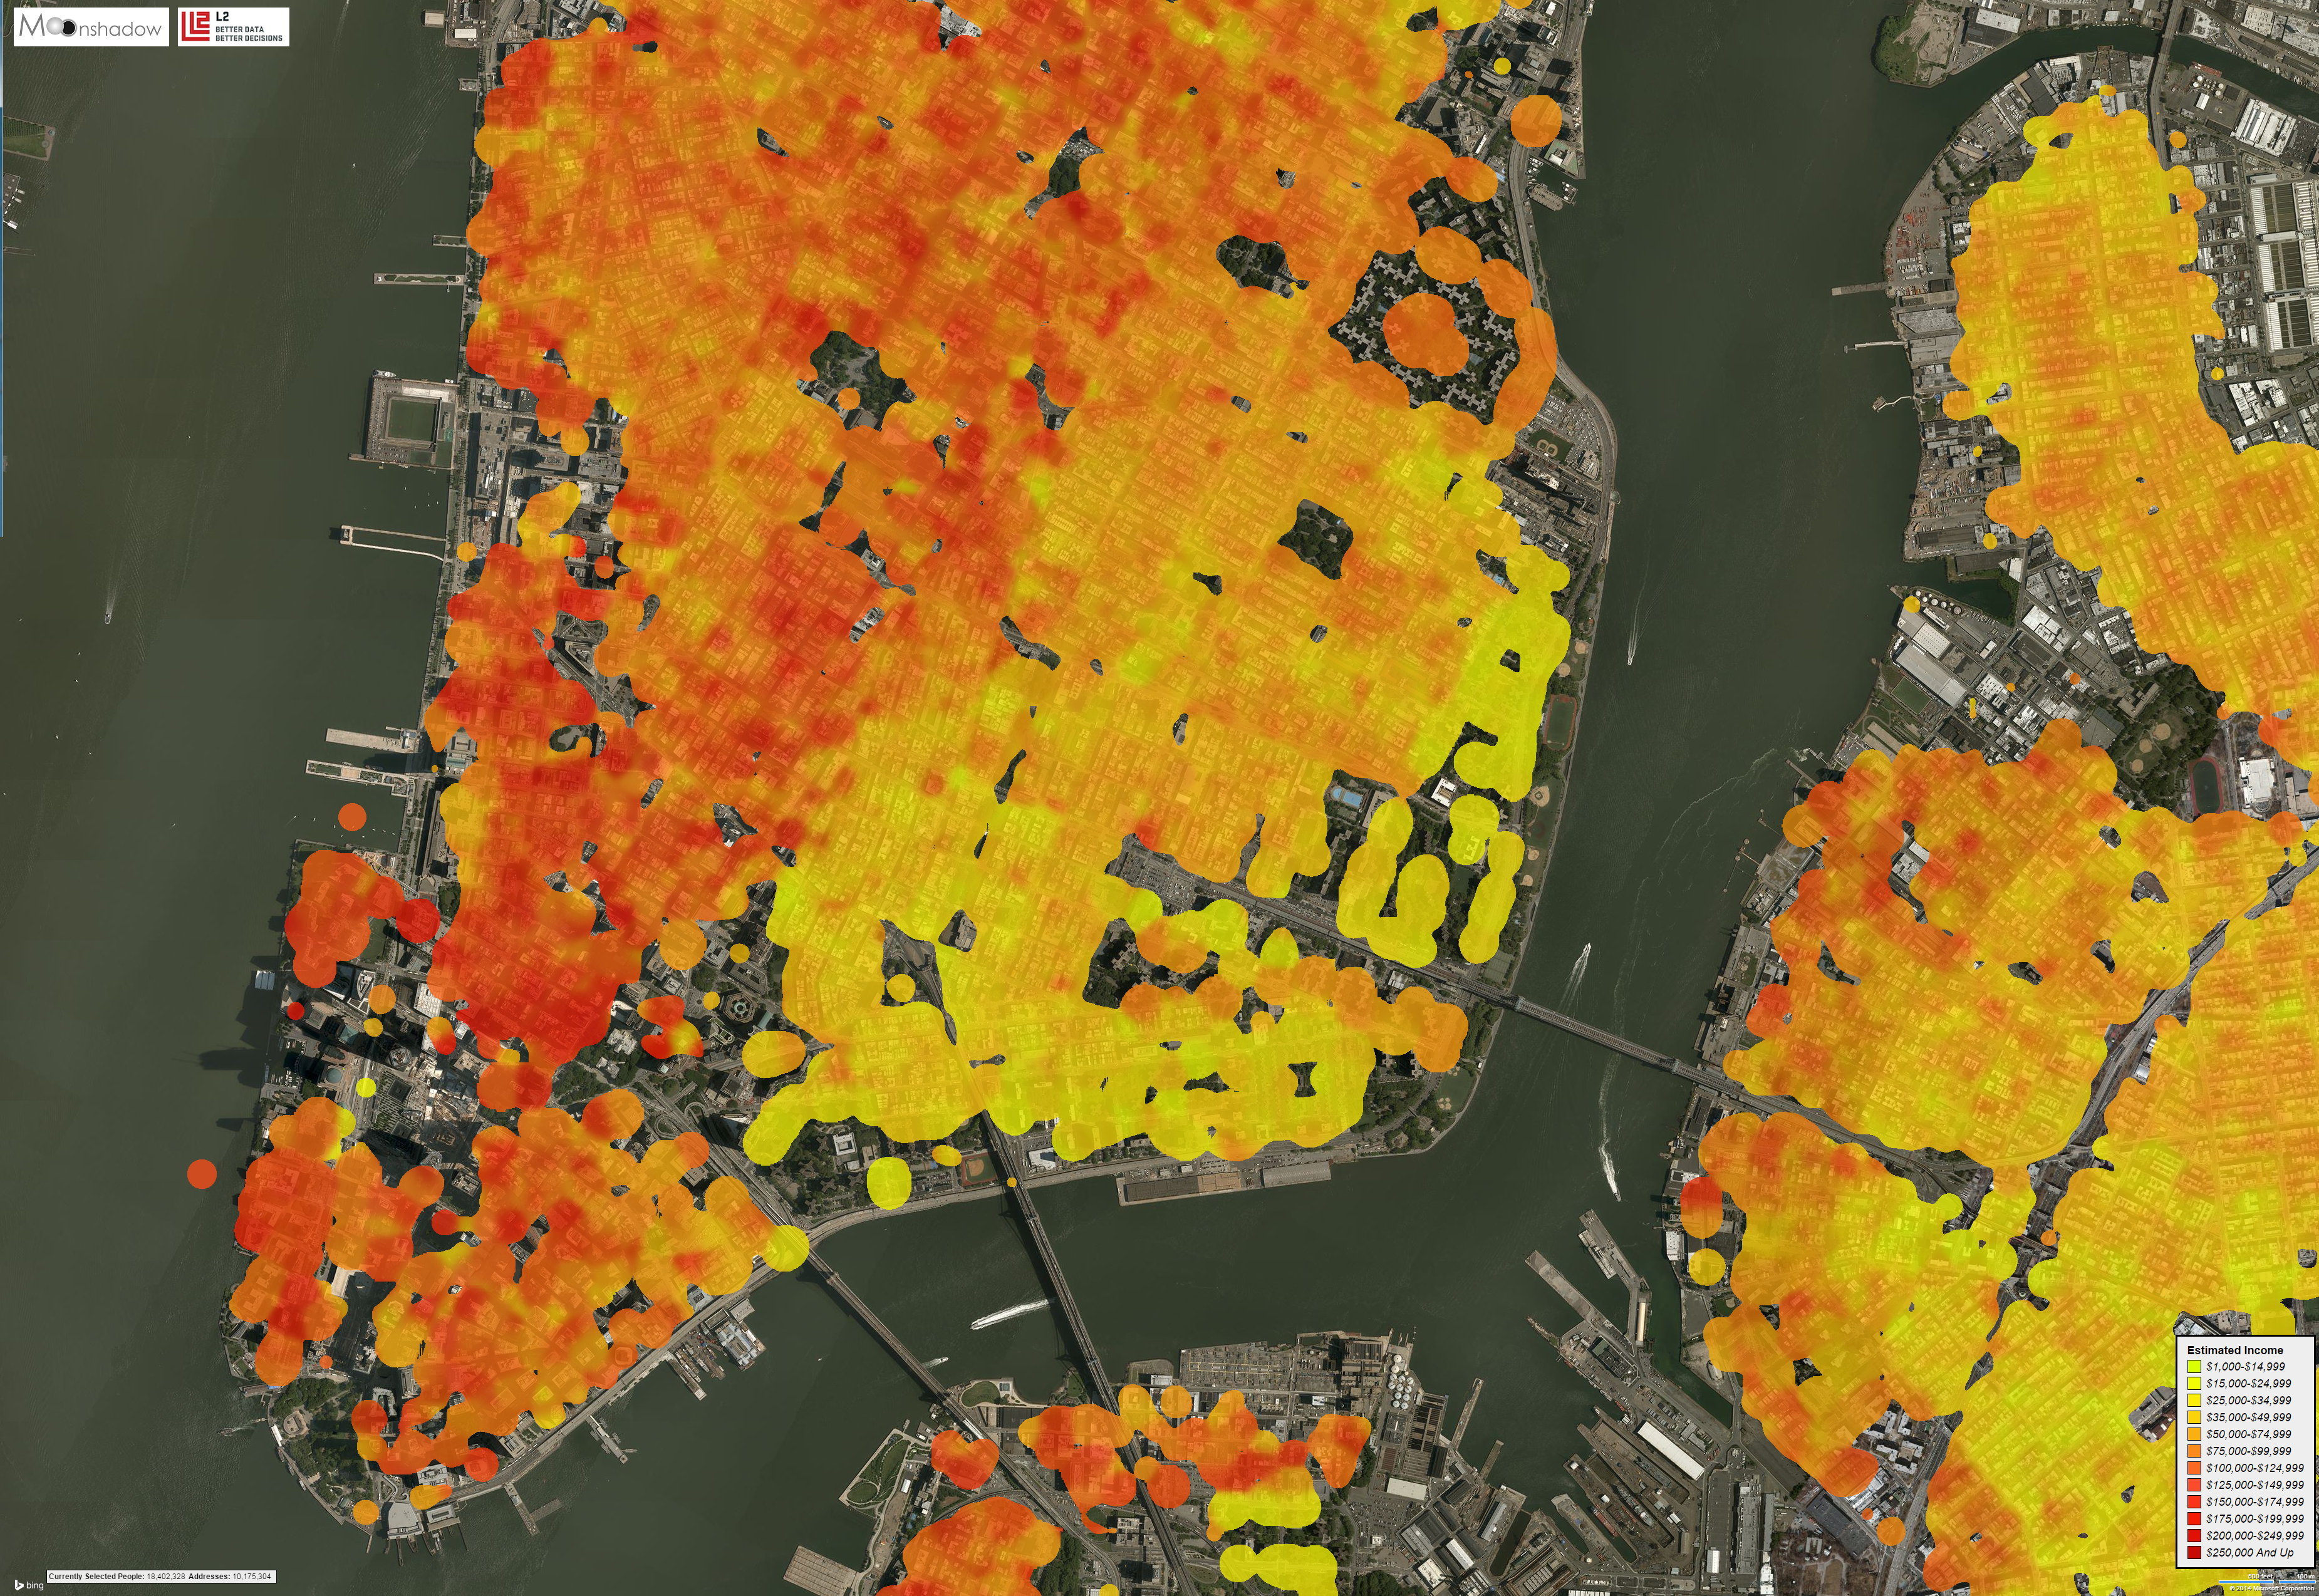
Income in Manhattan projected over Aerial Photos
These data visualizations were created in the following way. We used the population data from L2 and mapped each address to a geographical location using Bing Maps. The L2 database has income information on over one million people in Manhattan. The base color of each geographical point was determined by the average income of all people on that location. Moonshadow’s Ephemeris software uses Gaussian curves to ‘spread’ the income levels around each point to create ‘blobs’. With the Gaussian algorithms each income point influences the points around it but the further you go away from a point the less the influence is.
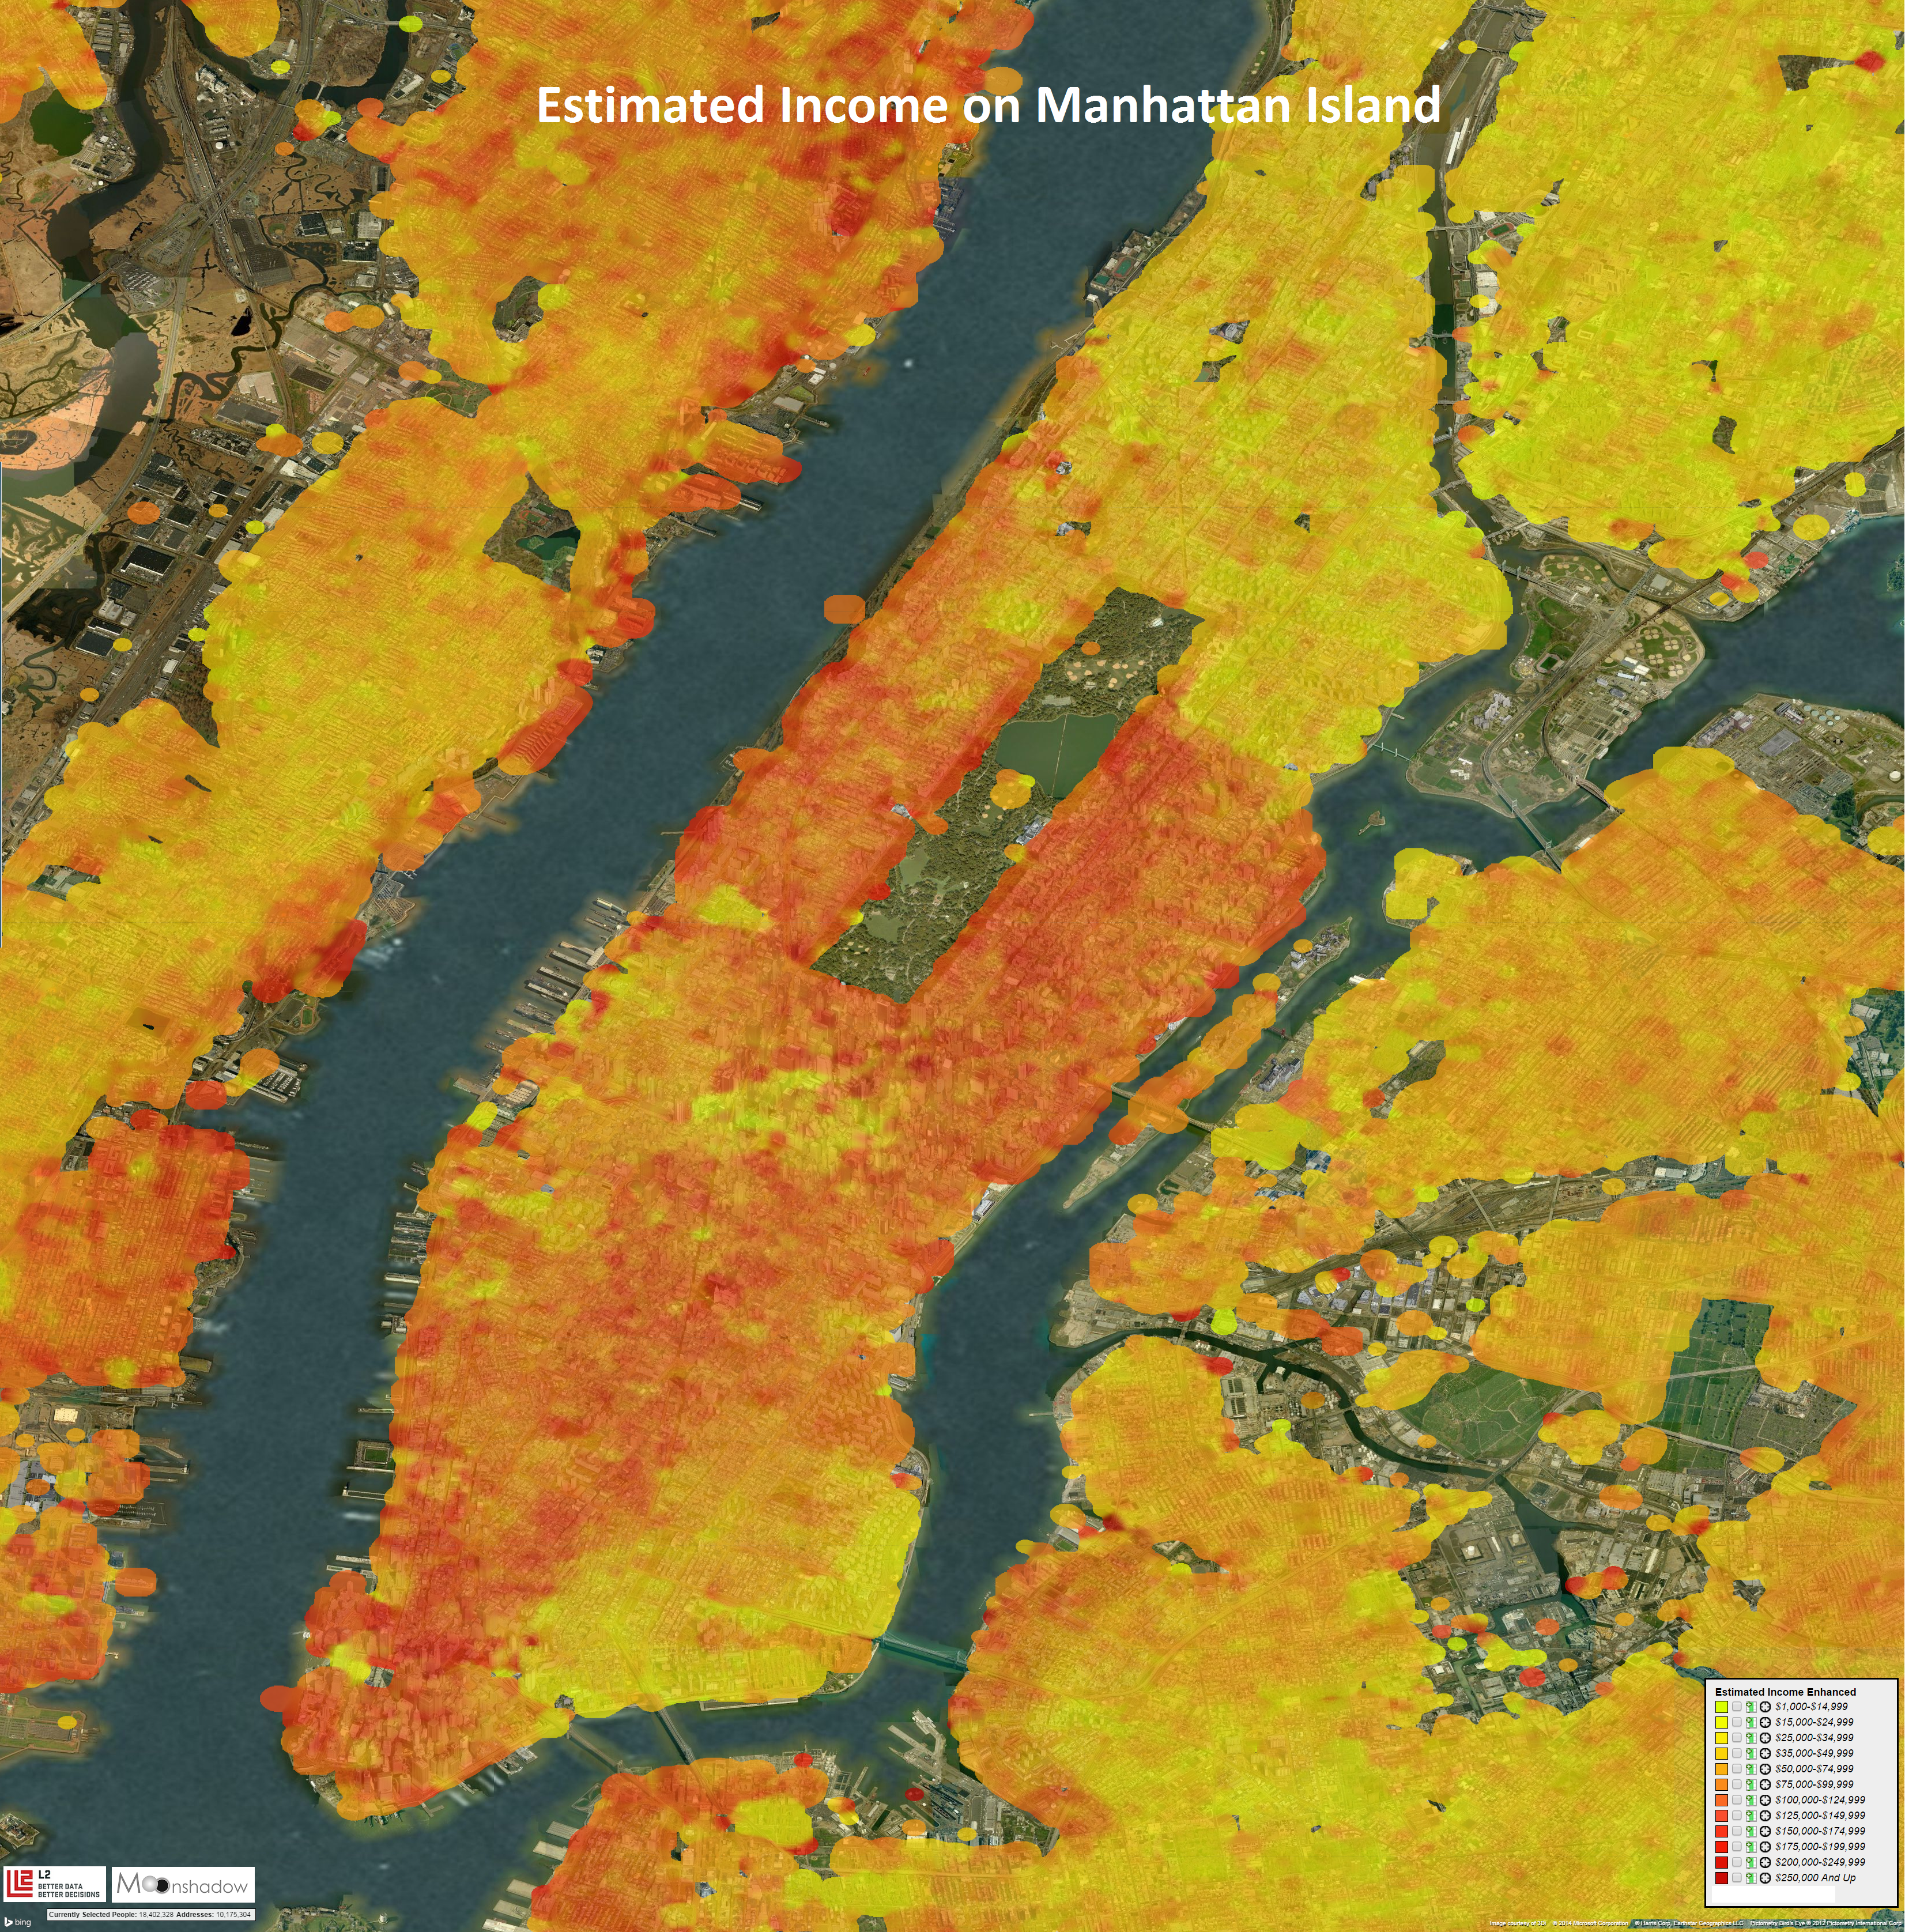
Income on Manhattan Island from lower incomes in yellow to higher incomes in red.
The image above shows income levels projected over the entire island of Manhattan in a resolution of 3305×3352. Click on the image to load a larger version and click once more to zoom in and view details. If you zoom in you can see that there is no income data in parks, over industrial areas, rivers and freeways. Geocoding is not a perfect science and sometimes people are positioned in the water or on parks. Moonshadow’s Ephemeris software generates these images in less than 500 milliseconds.

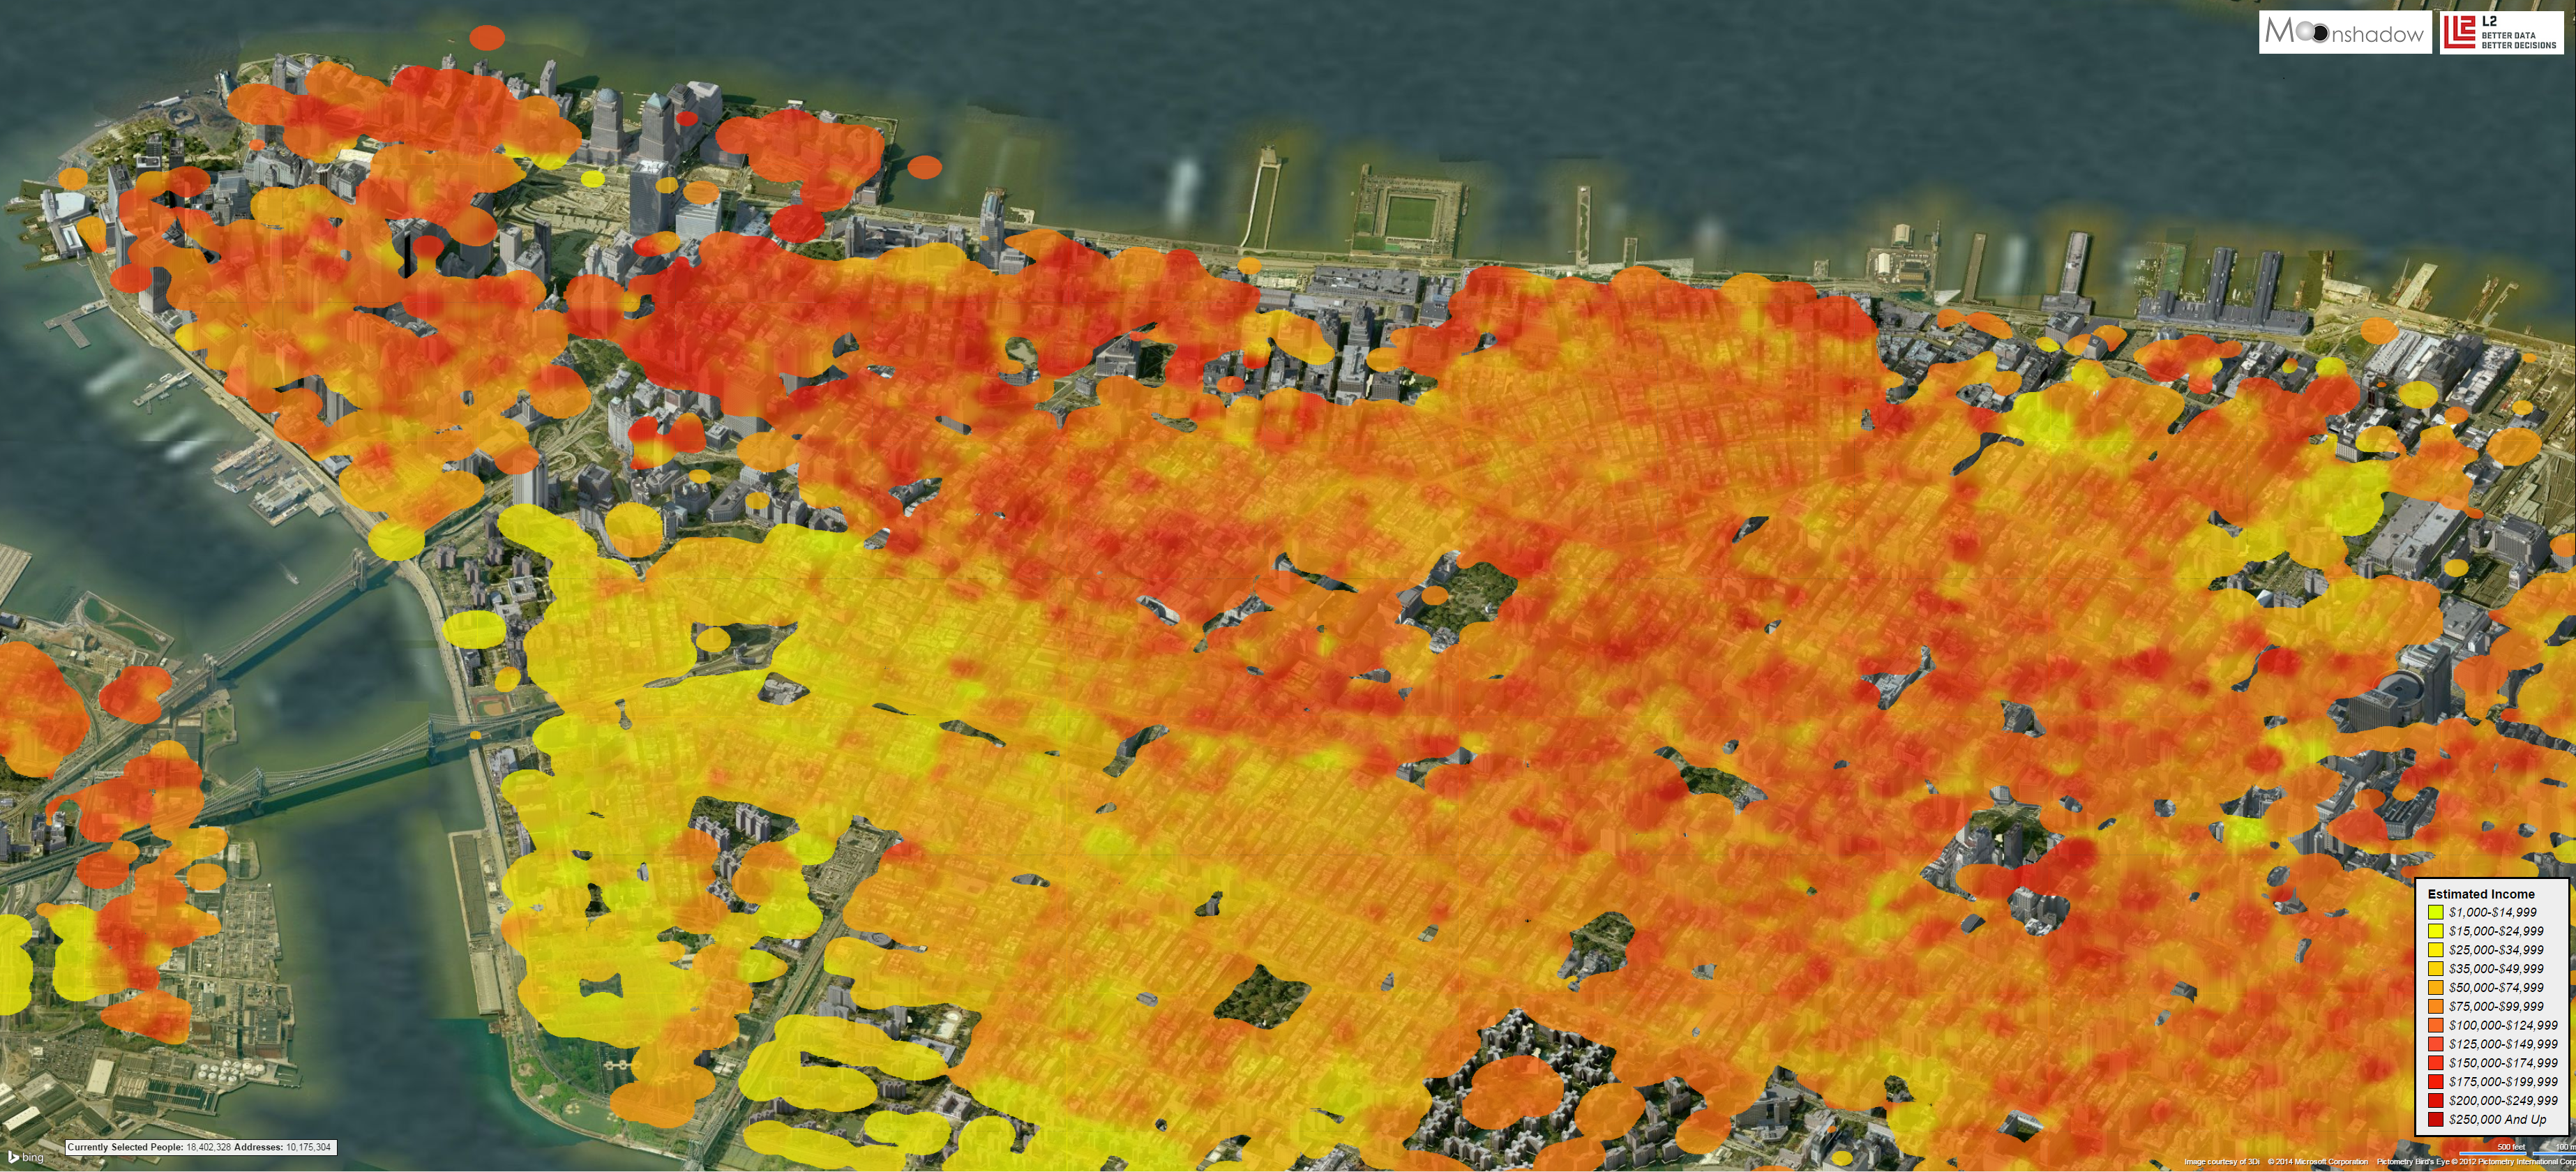
Manhattan Income over Satellite Images
In the above image we show the same data but now superimposed over satellite imagery. As a result you can exactly see the averaged income levels for each building. Click twice on the image to zoom in to the highest level of detail.
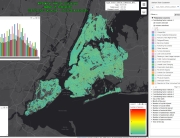
Manhattan Income over Aerial Photos Looking West
Bing Maps includes aerial photography for all four wind directions so you can rotate. In this image we look westward over Manhattan with the income data superimposed. Click twice on the image to zoom in two times.

