
Moonshadow Mobile has added a new visualization feature to its Ephemeris technology: Data Density Maps. With Data Density Maps Ephemeris visualizes both the density of an attribute and the values of an attribute at the same time over a map. The images on this page show both the population density as well as the Political Party registration.
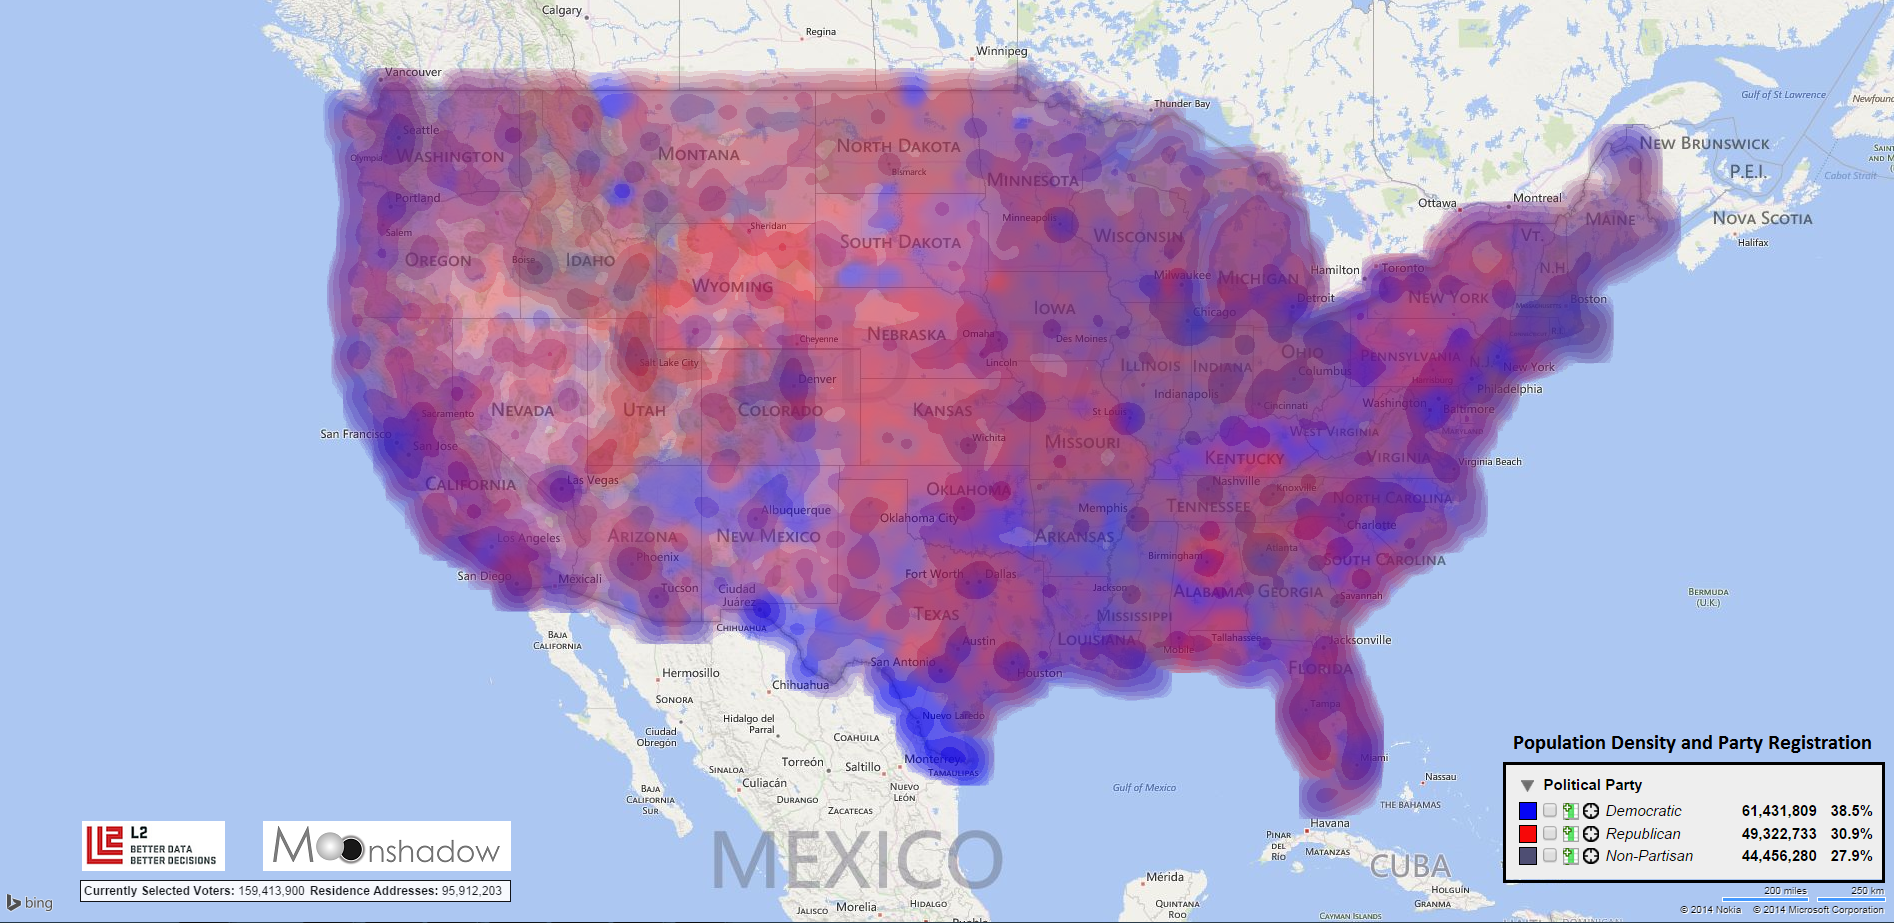
The map above is generated from the US registered voter file from L2 Political. Each of the 159 million voters in the US is mapped to their house inside of Bing Maps. A Gauss curve is then used to determine the average party affiliation of all points around the address. Republicans are shown in red and Democrats are shown in blue. As a result most areas show a variation of purple depending on the mix of Democrats and Republicans. The population density is shown by the intensity of the color. Contour lines are used as well to show the differences in population density where each contour line typically shows a doubling of the population density. The maps can be generated at every level of detail in any area of the country.

When you zoom in the data density maps are regenerated automatically at a finer level of detail. If the population falls below a certain density for an area of pixels on the map then the map below is shown, usually in white on land and in blue over the oceans. As you can see on the map above the city centers of Washington, DC, Philadelphia and New York City have the highest populations and are heavily Democrat. The areas around the cities a are still Democratic leaning. The further away you go from the city centers the lower the population density and the higher the percentage of Republicans.
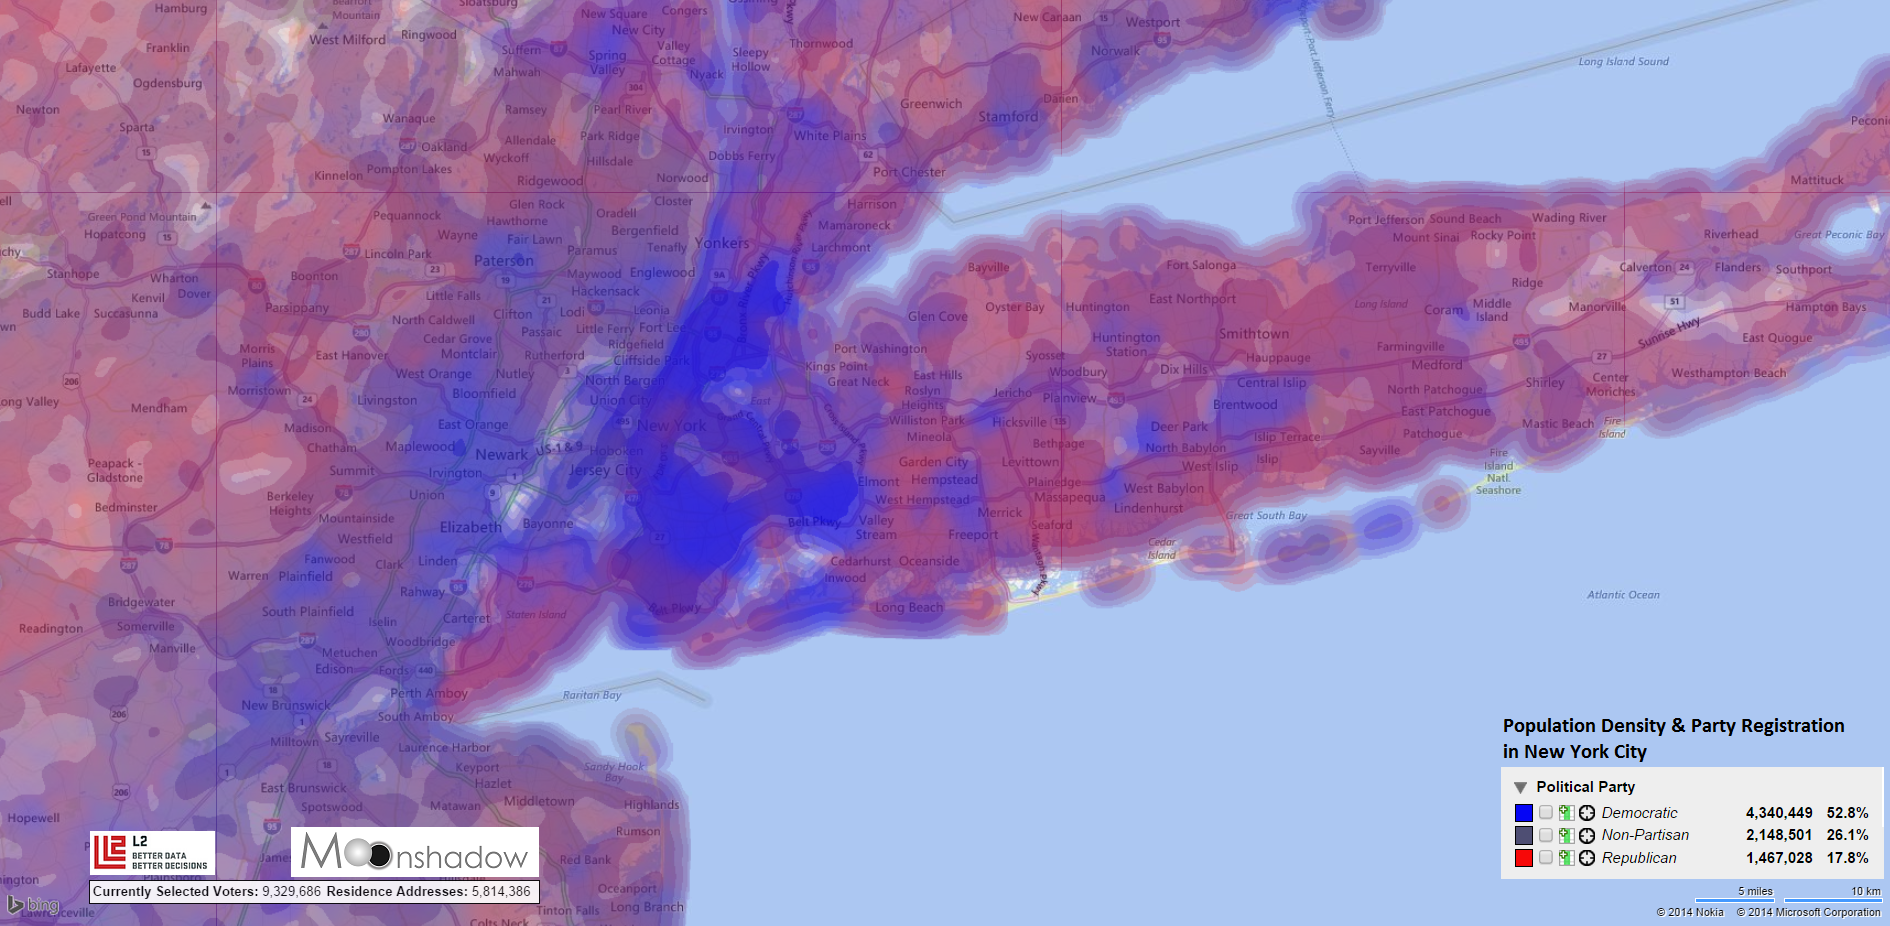
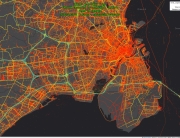
This image shows the population density and voter registration in the New York City area. As we zoom in ‘blobs’ break up in smaller blobs to show density differences.
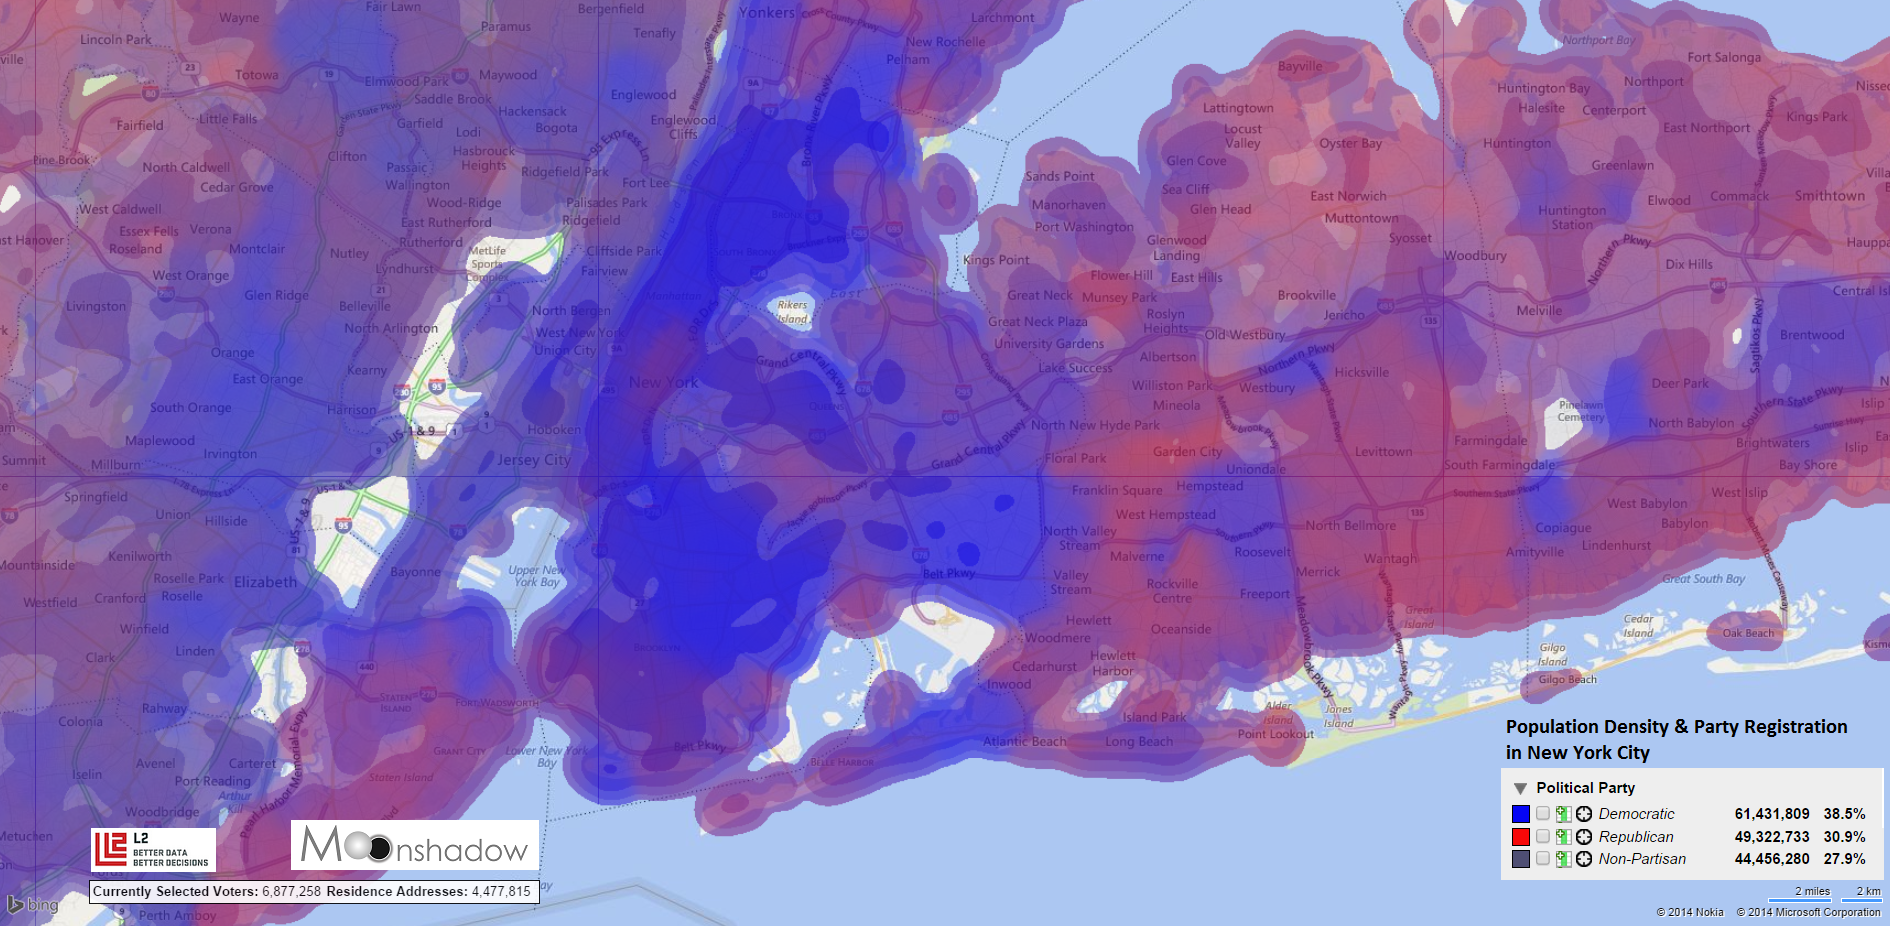
Zooming in further in Bing Maps gives an even more detailed view of population density and voter registration in New York City.
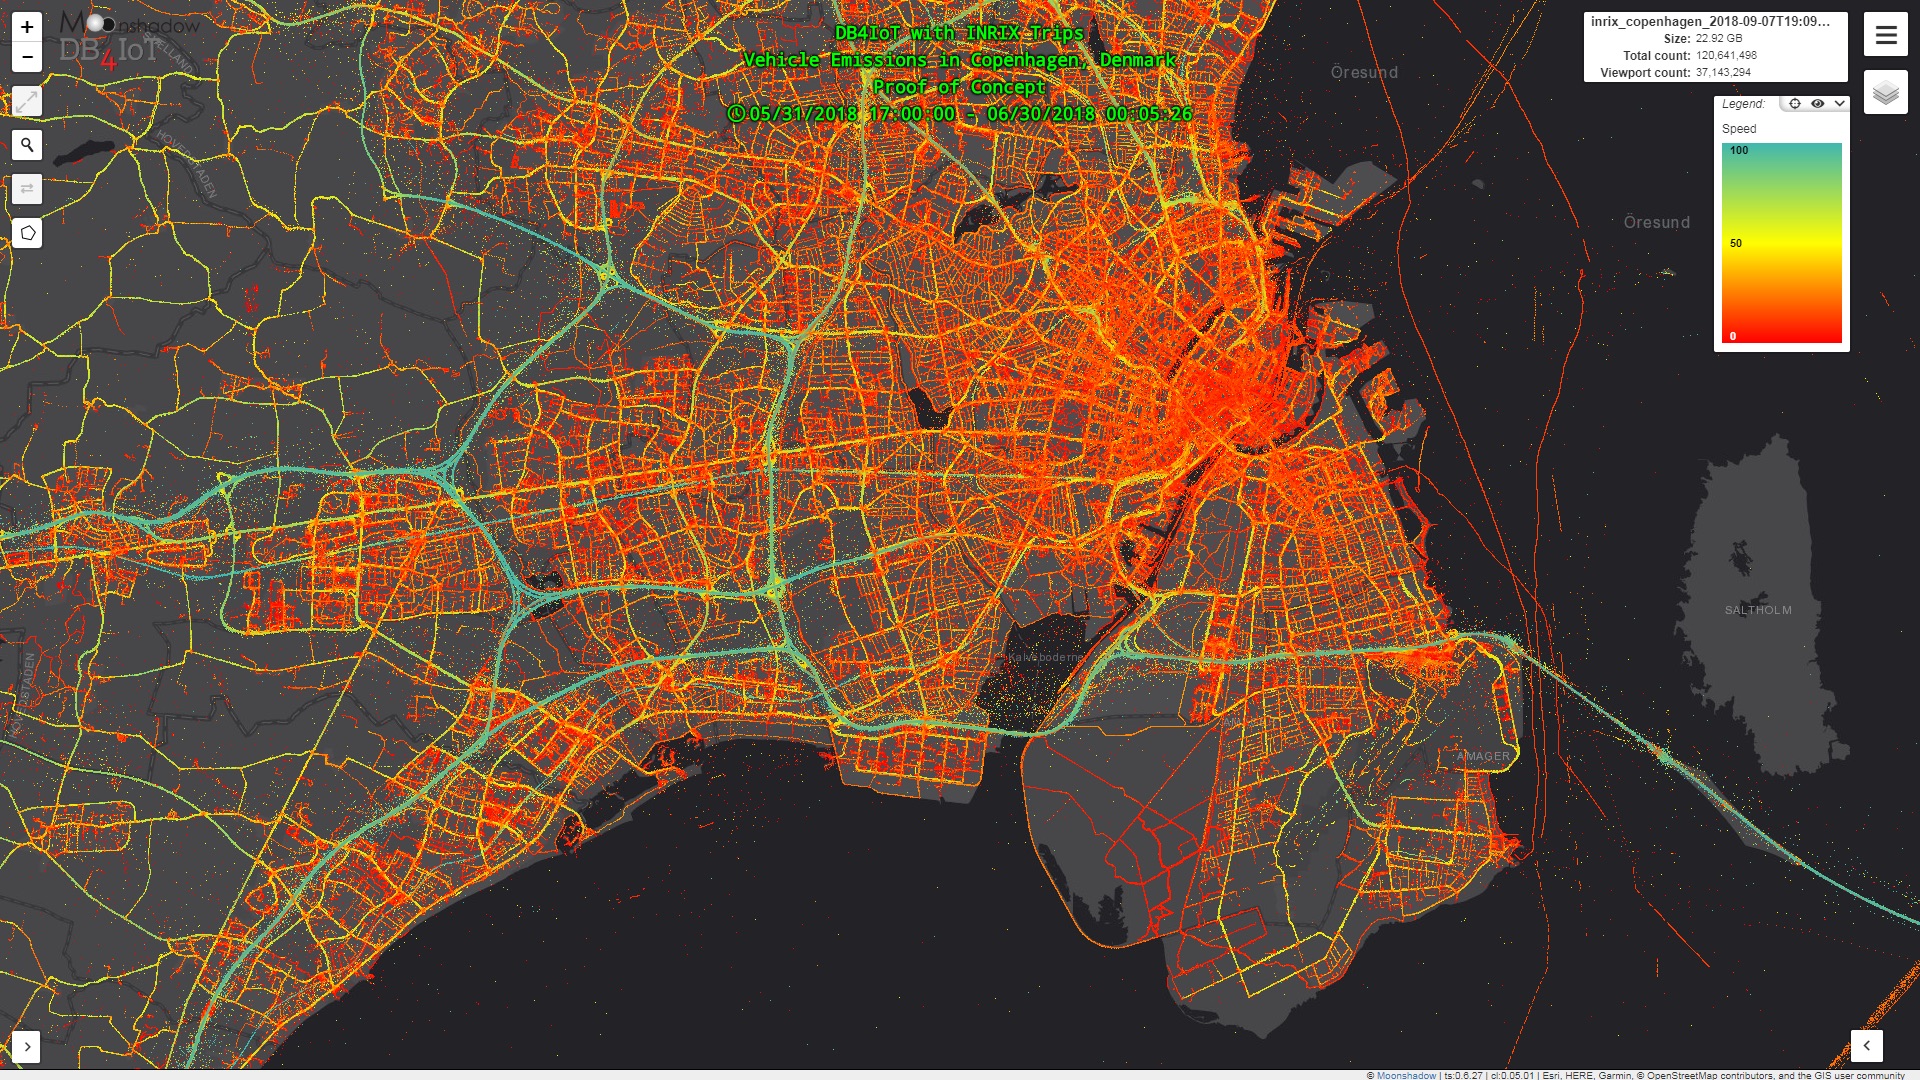
The Ephemeris data density mapping technology can visualize any type of information over maps anywhere in the world.
