
We’ve just added the Census 2000 data for all seven million census blocks and will add the Census 2010 block level data shortly after its release by the US Census Bureau in late March. This makes possible quick and easy access to demographic information via an intuitive user interface that encourages analysis and better understanding of shifting trends. It facilitates invaluable tools for planners, demographers, social scientists, architects, real estate professionals, marketers, politicians and anyone else interested in the specifics of the population of the US.

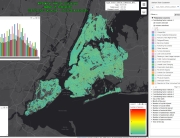
2000 Northeast US population – white vs. non-white ehtnic distribution – satellite view
Generate images showing all of the approximately 300 million people in the US. The data is shown as an image overlay displayed inside of Google Maps. Look at the entire US or zoom in to any level to focus on states, counties, cities or even individual city blocks. The data images are regenerated and refined at any zoom level. The underlying Google imagery can be changed from map, satellite, hybrid or terrain view at any level. Instantly view counts and percentages by age, ethnicity, gender and many other attributes as users are panning or zooming in Google Maps. Read more…

